Significant Factors Affecting the Group's Results of Operations
The significant factors that affected the Group’s results of operations during 2023 and 2022, and which the Company expects to continue to affect the Group’s results of operations in the future, include:
- the price received for the sale of natural uranium and changes in natural uranium product prices;
- changes in the Group structure;
- the impact of changes in foreign exchange rates;
- taxation, including mineral extraction tax;
- the cost and availability of sulphuric acid;
- inflation pressure on costs, as well as availability of critical operating materials caused by supplychain disruption;
- impact of changes in ore reserves estimates; and
- transactions with subsidiaries, JVs, JOs and associates.
PRICE RECEIVED FOR THE SALE OF NATURAL URANIUM AND CHANGES IN NATURAL URANIUM PRODUCT PRICES
Spot market prices for U3O8, which is the main marketable product of the Group, have the most significant effect on the Group’s revenue. The majority of the Group’s revenue is derived from sales of U3O8 under contracts with price formulae containing a reference to spot price. In addition to spot prices, the Group’s effective realized price depends on the proportion of contracts in the portfolio with a fixed price component in a given period. The average realized price for each period can therefore deviate from the prevailing spot market price. More information regarding the impact of spot market prices on average realized price is provided in Section Uranium sales price sensitivity analysis.
The following table provides the average spot price and average realized price per pound of U3O8 for the periods indicated:
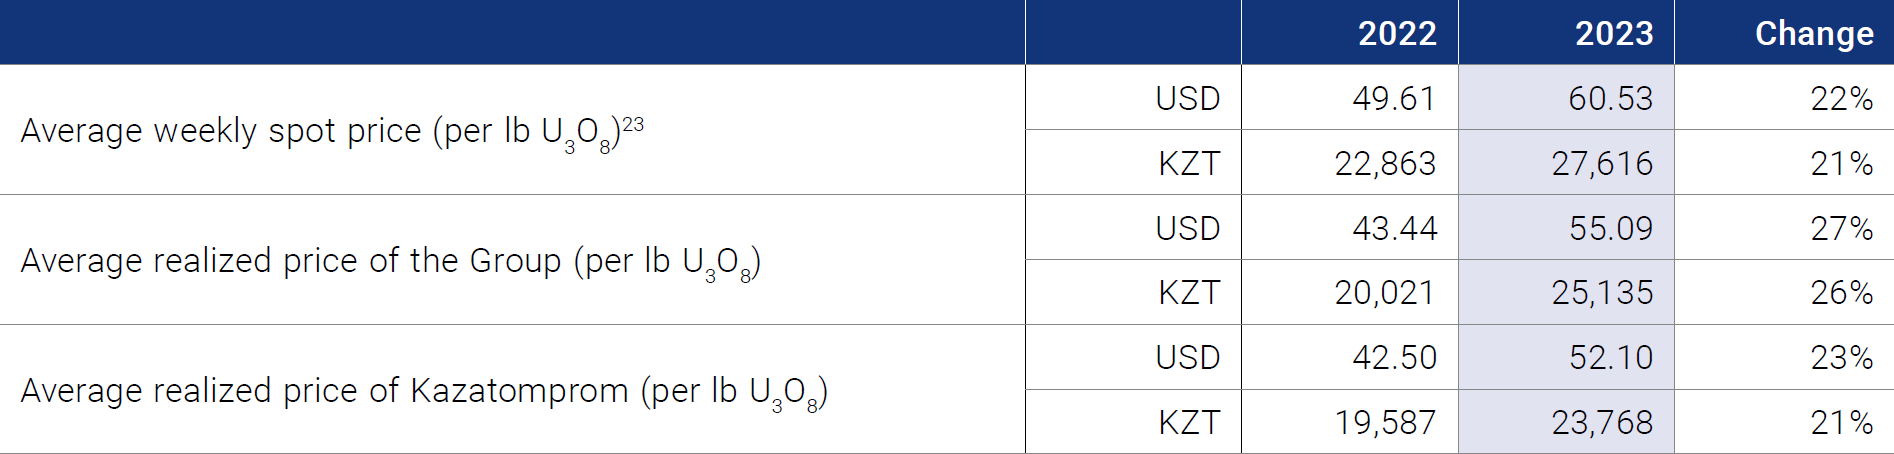
3 Prices per TradeTech LLC and UxC LLC.
The Company’s current overall contract portfolio price correlates to current uranium spot prices (see Section Uranium sales price sensitivity analysis). However, for short-term deliveries to consumers, there is a certain time lag between the date of pricing fixation according to the transfer pricing legislation of Kazakhstan and the spot market price at the time of actual delivery. The high market volatility during these time lags becomes more evident as prices fluctuate both during periods of growth and decline. Moreover, deliveries under some long-term contracts in 2023 incorporated a proportion of fixed price component, including price ceilings that were negotiated during a comparatively lower price environment. As a result, although the average realized price of the Company and the Group for the reporting period increased compared to 2022, outpaced the rise in uranium spot prices during this timeframe, still the average realized prices turned out to be lower than the average weekly spot price for the reporting period.
For additional details related to specific market developments that influenced the pricing of uranium in 2023, please see the Kazatomprom 4Q2023 Operations and Trading Update, available on the corporate website www.kazatomprom.kz.
CHANGES IN THE GROUP STRUCTURE
In 2023, the Group completed the following transactions:
- On 30 December 2021, a Purchase and Sale Contract of 40% of shares in Caustic JSC was signed between the Company and Trading House United Chemical Technologies LLP. According to the terms of the contract, payment for shares was made in instalments. On 28 March 2023, Trading House United Chemical Technologies LLP made full payment under the contract. On 11 April 2023, a Certificate confirming the acceptance and transfer of shares was signed.
- In January 2024, as part of a restructuring aimed at simplifying and optimizing the ownership structure, Kazatomprom divested a 49% stake in the charter capital of Taiqonyr Qyshqyl Zauyty LLP (TQZ LLP') to Kazatomprom-SaUran LLP. A significant step towards securing investment for the construction of a new sulphuric acid plant was achieved through the establishment of a strategic partnership with the renowned Italian firm, Ballestra S.p.A., and Kazatomprom’s Board of Directors made a decision to engage a local partner of Ballestra in Kazakhstan for this project. Under this partnership, Ballestra will assume responsibility for the project's design, equipment procurement, and provision of technical support. It is worth noting that Ballestra's technology has a well-documented history of successful implementation at the existing sulphuric acid plants, SKZ-U LLP and SSAP LLP.
In 2022:
- According to the Framework Agreement signed on November 22, 2021, between the Group and Genchi Global Limited on participation in ANU Energy, established on the basis of the Astana International Financial Center (AIFC). The purpose of ANU Energy is to store physical uranium as a long-term investment. The Group made an investment of USD 24.25 million in March 2022 (equivalent to KZT 12,368 million), which constitutes 32.7% of the entity's equity. The Group does not have representation in the governing body of the entity and does not take part in the decision-making of the entity. Accordingly, the Group does not have a significant influence on the management operations of the entity, and the Group, therefore, recognizes this investment at fair value through profit or loss. As of 31 December 2022, the Group classifies ANU Energy as “other investments” within other financial assets in the consolidated financial statements. As of 31 December 2023, the fair value of investment in ANU Energy OEIC Ltd. was KZT 30,667 million (2022: KZT 17,066 million).LLP.
In total, the number of the Group’s subsidiaries, JVs, JOs, associates and other equity investments has increased to 36 as at 31 December 2023.
IMPACT OF CHANGES IN EXCHANGE RATES
The Group's exposure to currency fluctuations is associated with sales, purchases and loans in foreign currencies. Significant cash flows of the Group are in USD due to:
- uranium is generally priced in USD, therefore most of the Group’s consolidated sales revenue is generated in USD (92% in 2023, 90% in 2022);
- the Company purchases uranium and uranium products from its JVs and associates pursuant to KZT-denominated contracts, with the prices determined by reference to prevailing spot market prices of U3O8, which are in USD;
- most of the Group’s borrowings are denominated in USD (96% in 2023, 95% in 2022), which is the principal currency of the Group’s revenue. For more details see Section Indebtedness.
A significant portion of the Group’s expenses, including its operating, production and capital expenditures, are denominated in KZT. Accordingly, as most of the Group’s revenue is denominated in USD, while a significant share of its costs is KZT-denominated, the Group generally benefits from the appreciation of USD against KZT, which subsequently has a positive effect on the Group’s financial performance. However, given that the Group has outstanding USD-denominated liabilities the positive effect of USD appreciation may fully or partially be offset. In addition, the Company purchases uranium and uranium products from its JVs and associates pursuant to KZT-denominated contracts, with the prices determined by reference to prevailing spot market prices of U3O8, which are denominated in USD. Accordingly, a significant appreciation of USD would result in a corresponding increase in the KZT-denominated price of such contracts.
The Group attempts to mitigate the risk of fluctuations in the exchange rate, where possible, by matching the currency denomination of its payments with the currency denomination of its cash flows. Through this matching, the Group achieves natural hedging without the use of derivatives.
In 2023, the KZT/USD exchange rate fluctuated between KZT 431.08 and KZT 482.77 (2022: KZT 414.67 and KZT 512.19). As at 31 December 2023, the National Bank of the Republic of Kazakhstan (NBK) KZT/USD exchange rate was KZT 454.56 (as at 31 December 2022 was KZT 465.65). Changes in exchange rates had a negative effect on the financial performance of the Group in 2023. The Group’s incurred a net foreign exchange loss of KZT 21,330 million in 2023 (compared to an exchange rate profit of KZT 17,304 million in 2022).
The following table provides the annual average and year-end closing KZT/USD exchange rates, as reported by the National Bank of the Republic of Kazakhstan (NBK), as of 31 December 2023 and 2022.
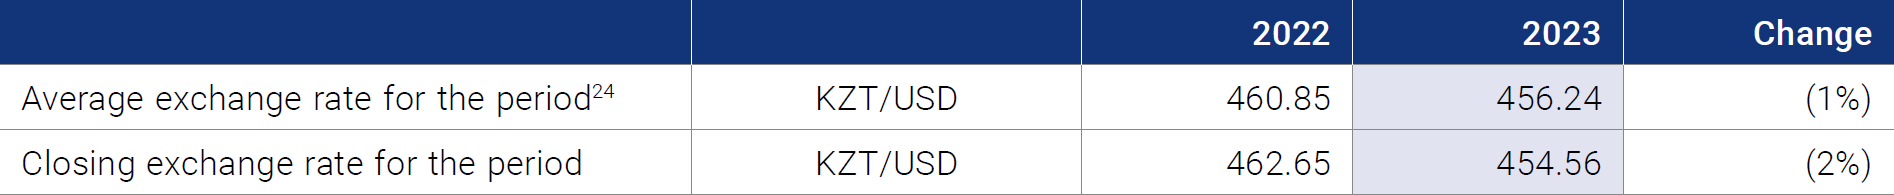
24 The average rates are calculated as the average of the daily exchange rates on each calendar day.
TAXATION AND MINERAL EXTRACTION TAX (“MET”)
Before 01 January 2023, MET was determined by applying a 29% tax charge to the taxable base related to mining production costs (see footnote under the table below). Taxable expenditures were made up of all direct expenditures associated with mining operations, including wellfield development depreciation charges and any other depreciation charges allocated to direct mining activities, but excluded processing and general and administrative expenses. The MET is calculated separately for each subsoil use license. The resulting MET paid was therefore directly dependent upon the cost of mining operations.
In January 2022, the Government of the Republic of Kazakhstan announced that it intended to update the country’s tax code. On 11 July 2022, additions and amendments to the Kazakh tax code were adopted (Laws of the Republic of Kazakhstan On the Enactment of the Code of the Republic of Kazakhstan “On Taxes and Other Mandatory Payments to the Budget No.135- VII LRK), which introduced changes in the MET base and rate for tax calculation. The amended tax code came into force beginning 01 January 2023. In accordance with the introduced changes, the tax base for MET on uranium is determined as the weighted average price of uranium from public sources for the specific reporting period, multiplied by the amount of uranium mined and a MET rate of 6%.
The following table provides a summary of taxes accrued by the Group for the years shown:
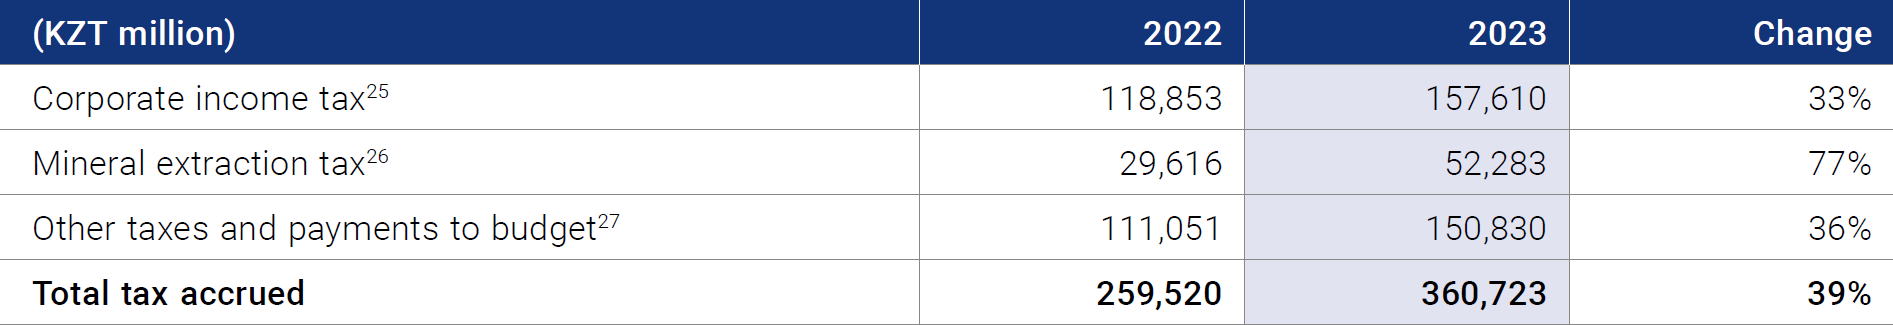
25 Applicable rate: 20%; calculation: taxable income (based on tax reporting accounts) multiplied by corporate income tax rate.
26 Applicable rate and calculation from 2023 and further: 6% × (average month-end spot price for period) × (volume of uranium mined). Previously applicable rate: 18.5% for uranium cost in pregnant solution; calculation: the tax charge is a cost of mining and is based on a deemed 20% profit margin on certain expenditures, and a MET rate of 18.5%. The tax charge of 29% is determined by the following formula: (1 + 20%) × 18.5% ÷ (1 – (1 + 20%) × 18.5%).
27Including VAT, property tax, land tax, transport tax, social tax, other payments to budget and PIT (on PIT Company acts as a tax agent).
The total amount of accrued taxes increased by an average of 39% by the end of 2023 compared to 2022, due to:
- The increase in corporate income tax by 33% is due to an increase in pre-tax profit associated with an increase in the average selling price related to the growth of the market spot price and increase in sales volume of U3O8 (see Sections Consolidated Revenue and Other financial indicators and Profit before tax and income tax expenses);
- an increase in the MET by 77% is due to an increase in the spot price for U3O8, as well as change in the tax base for calculating the MET since 1 January 2023;
- an increase in other taxes and other payments to the budget by 36%, which is mainly due to an increase in accrued value added tax as a result of the growth of the value of intra-group sales in the territory of the Republic of Kazakhstan.
COST AND AVAILABILITY OF SULPHURIC ACID
Extraction of uranium using the ISR mining method requires substantial amounts of sulphuric acid. If sulphuric acid is unavailable, it could impact the Group’s production schedule, while higher prices for sulphuric acid could adversely impact the Group’s profits.
The Group’s weighted average cost of sulphuric acid increased by 33.6% to KZT 40,455 per tonne in 2023 (2022: from KZT 30,263 per tonne) due to the increase in the price of raw materials and temporary shortages in the Kazakhstan market. On average in 2023, expenses on sulphuric acid represented about 10% of the Group’s uranium production costs (12% in 2022).
Looking ahead in the medium term, the existing deficit of sulphuric acid is expected to alleviate as a result of the potential increase in sulphuric acid supply from local non-ferrous metals mining and smelting operations. The Company also intends to enhance its in-house sulphuric acid production capacity by constructing a new plant Taiqonyr Qyshqyl Zauyty LLP (see Section Changes in the Group structure). As previously disclosed, the construction of the sulphuric acid plant serves as a strategic risk mitigation initiative aimed at ensuring self-reliant production capabilities. The plant is anticipated to have a nominal capacity of 800,000 tonnes of sulphuric acid annually. When combined with the existing supply volumes of SKZ-U LLP and SSAP LLP, totalling around 680,000 tonnes, Kazatomprom envisions a consolidated sulphuric acid supply volume of approximately 1.5 million tonnes.

INFLATION-RELATED COSTS, AS WELL AS AVAILABILITY OF CRITICAL OPERATING MATERIALS & EQUIPMENT
The extraction of uranium using the ISR mining method requires the import of certain key operating materials and components. These items are either imported into Kazakhstan directly by the Group, or they are imported by local suppliers from whom the Group procures such materials.
In some cases, shipping and availability constraints have resulted in a higher cost to acquire the necessary operating materials, including inflationary pressure as a result of commodity price changes, driving an increase in production costs and a negative impact on profitability (see Section Uranium segment production and sales metrics).
IMPACT OF CHANGES IN ORE RESERVES ESTIMATES
The Group reviews its JORC-compliant estimates of Ore Reserves and Mineral Resources on an annual basis, including a review of the estimates by a qualified third party. As a result, certain Ore Reserves and Mineral Resources may be reclassified annually in accordance with applicable standards. Such reclassifications may have an impact on the Group’s financial statements. For example, if a reclassification results in a change to the Group’s life of mine plans, there may be a corresponding impact on depreciation and amortization expenses, impairment charges, as well as mine closure charges incurred at the end of the life of mine.
TRANSACTIONS WITH SUBSIDIARIES, JVS, JOS AND ASSOCIATES
The Company purchases U3O8 from its subsidiaries, JOs, JVs and associates, principally at spot price with market-based discounts, which may vary by operation. Purchased volumes generally correspond to the Company’s interest in the respective selling entities.
The Group’s Uranium segment revenue is primarily composed of two streams:
- the sale of U3O8 purchased from operations (JVs and associates), the third parties; and
- the sale of U3O8 produced by the Company and by its consolidated subsidiaries and JOs.
Cost of sales of purchased uranium is equal to the purchase price from JVs and associates, which in most cases is the prevailing spot price with certain applicable discounts. The share of results of JVs and associates represents a significant part of the Group’s profits and should be considered in the assessment of the Group’s financial results. In 2023, U3O8 was purchased at a weighted average discount of 3.63% (2022: 3.73%) on the prevailing spot price.
When uranium produced by the Company, consolidated subsidiaries and JOs, is sold, the cost of sales is predominantly represented by the cost of production. For those sales, the entire profit margin from uranium products, including uranium for export is reflected in the Group’s consolidated results.
The following table provides the volumes purchased by the Company for the periods indicated.
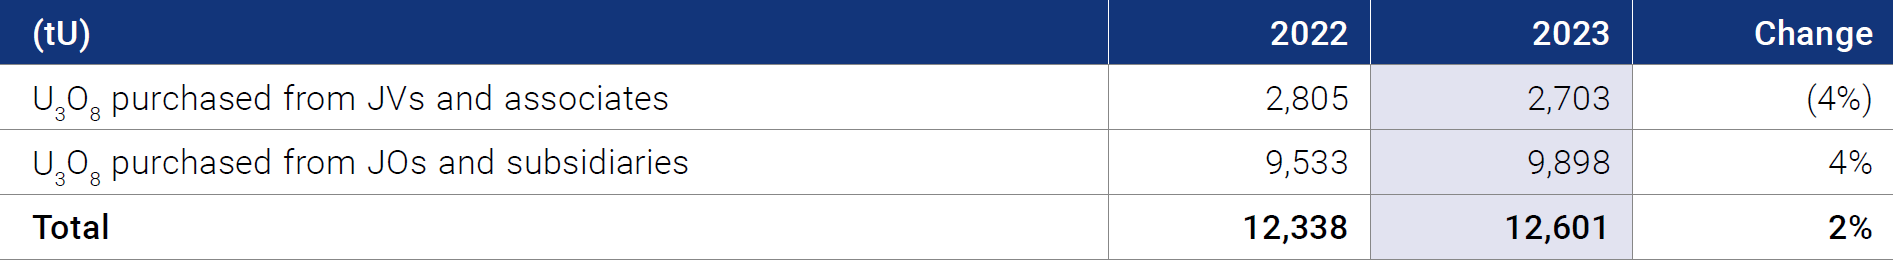
In 2023, the volume of U3O8 purchased from JVs and associates, JOs and Subsidiaries was comparable to 2022 and comprised 12,601 tonnes (2022: 12,338 tonnes).
In addition to the above volumes, the Company (including its trading subsidiary THK) also purchases volumes from third parties at variable prices.
Key Performance Indicators Analysis
CONSOLIDATED FINANCIAL METRICS
The analysis in this section of the report is based on 12 months ended 31 December 2023 compared to 12 months ended 31 December 2022. The table below provides financial information related to the consolidated results of the Group for 2023 and 2022.
CONSOLIDATED REVENUE AND OTHER FINANCIAL METRICS
The Group’s consolidated revenue was KZT 1,434,635 million in 2023, an increase of 43% compared to 2022 (in 2022 the Group’s consolidated revenue was KZT 1,001,171 million).
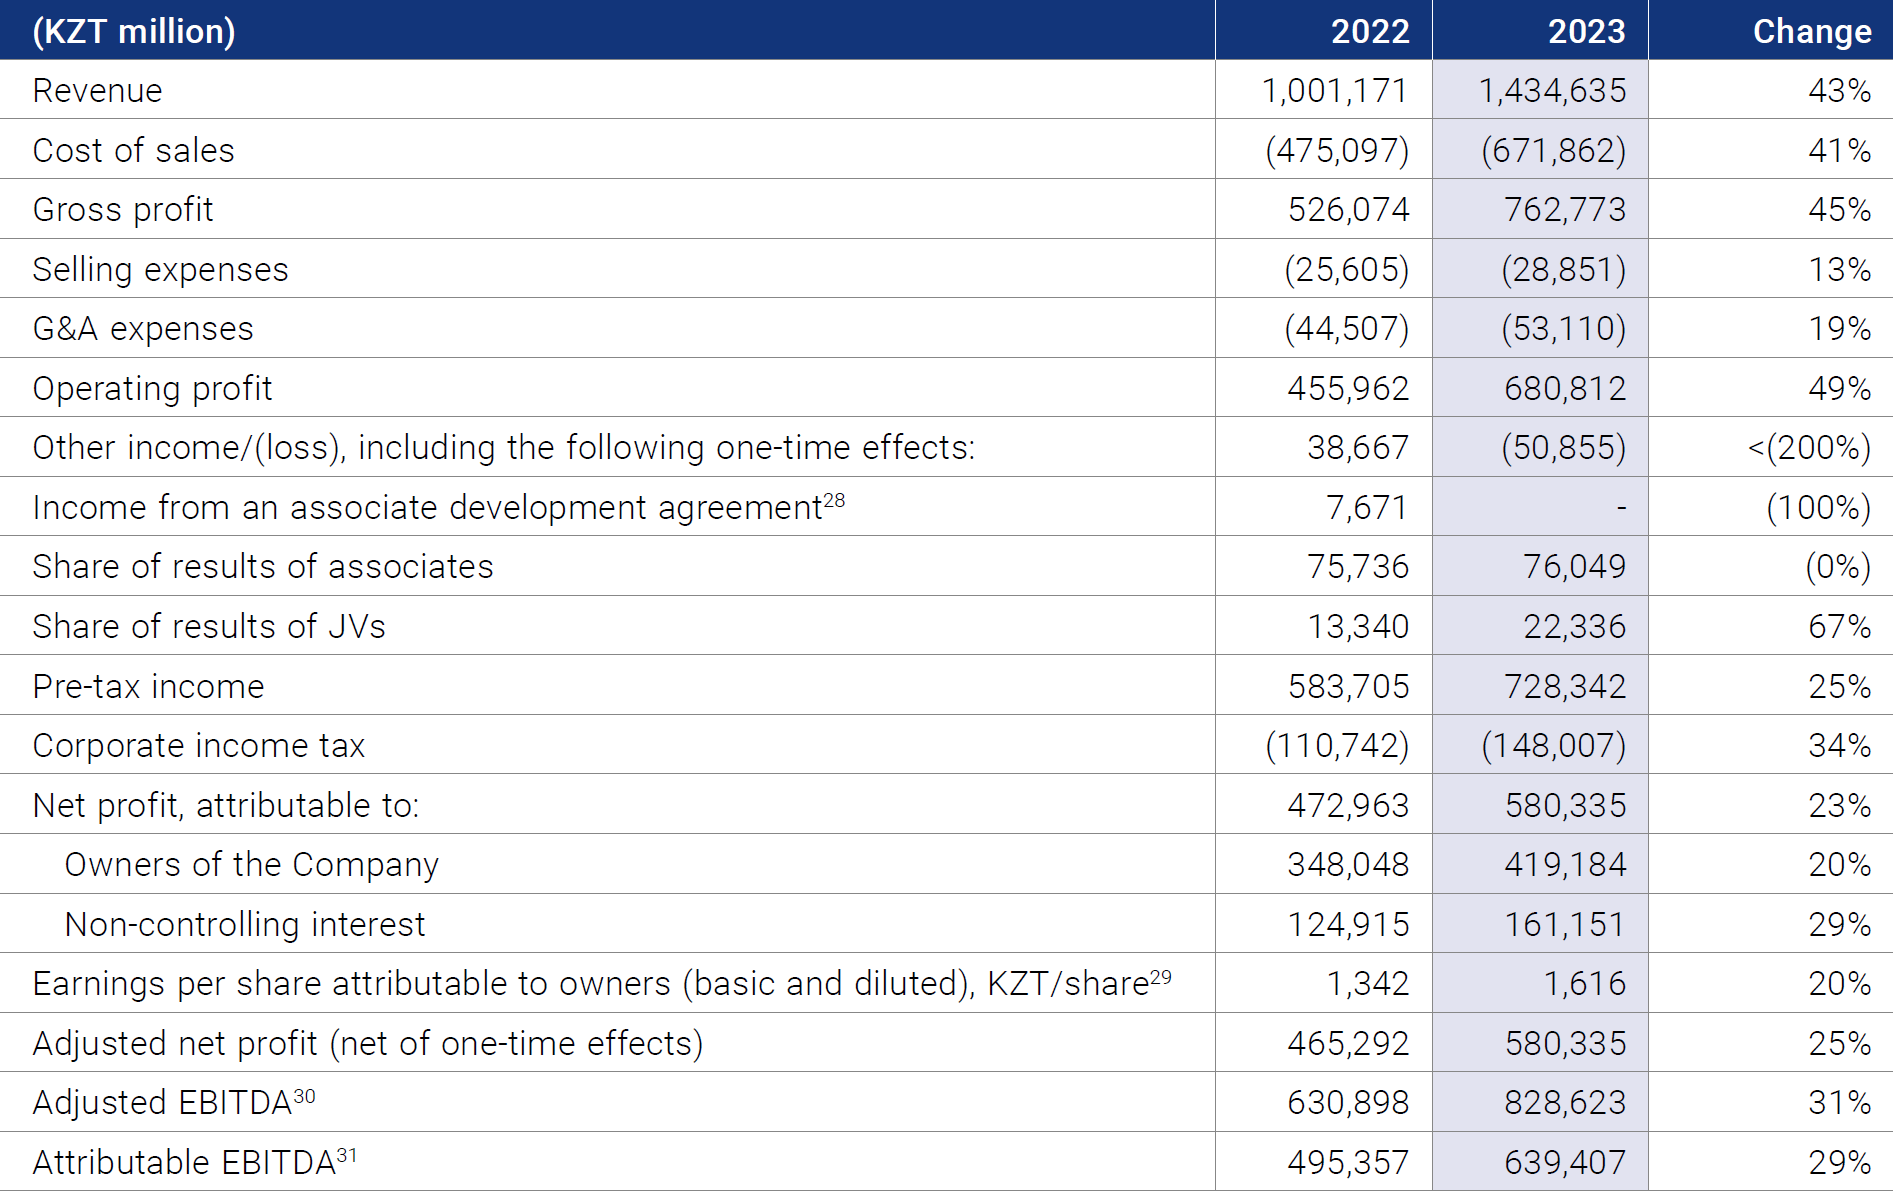
28 On 11 August 2022, the JV Katco LLP participants made amendments to the Partnership Agreement on the further development of JV Katco LLP since 10 April 2017, under which the Group became entitled to compensation in the amount of KZT 7,671 million from the second participant of JV Katco LLP, which was recognized as other income in 2022 and other receivables.
29 Calculated as: Profit for the year attributable to owners of the Company divided by Total share capital from Section Outstanding shares, rounded to the nearest KZT.
30 Adjusted EBITDA is calculated by excluding from EBITDA items not related to the main business and having a one-time effect. Calculation: Profit before tax - finance income + finance expense +/- Net FX loss/(gain) + Depreciation and amortisation + Impairment losses - reversal of impairment +/- one-off or unusual transactions.
31 Attributable EBITDA (previously “Adjusted Attributable EBITDA”) is calculated as: Adjusted EBITDA less the share of the results in the net profit in JVs and associates, plus the share of Adjusted EBITDA of JVs and associates engaged in the uranium segment (including share of Adjusted EBITDA of JV Budenovskoye LLP for 2023 in the amount of KZT 3,048 million, while in 2022 it is excluded due to minor effect), less non-controlling share of adjusted EBITDA of APPAK LLP, JV Inkai LLP, “Baiken-U” LLP, ORTALYK LLP and JV Khorasan-U LLP, less any changes in the unrealized gain in the Group.
The increase is mainly due to:
- the growth in the average realized price associated with an increase in the market spot price for U3O8;
- an increase in sales volume of U3O8 (see Section Uranium segment production and sales metrics) mainly related to additional requests from customers, as well as some new long-term contracts;
- increase in revenue from sale of uranium products (including fuel pellets and tolling services) related to growth of FA deliveries by Ulba-FA LLP in 2023, and increase in revenue from UMP segment rare metal products (see Section UMP Segment).
The main revenues by source in 2023 compared to 2022, are presented below.
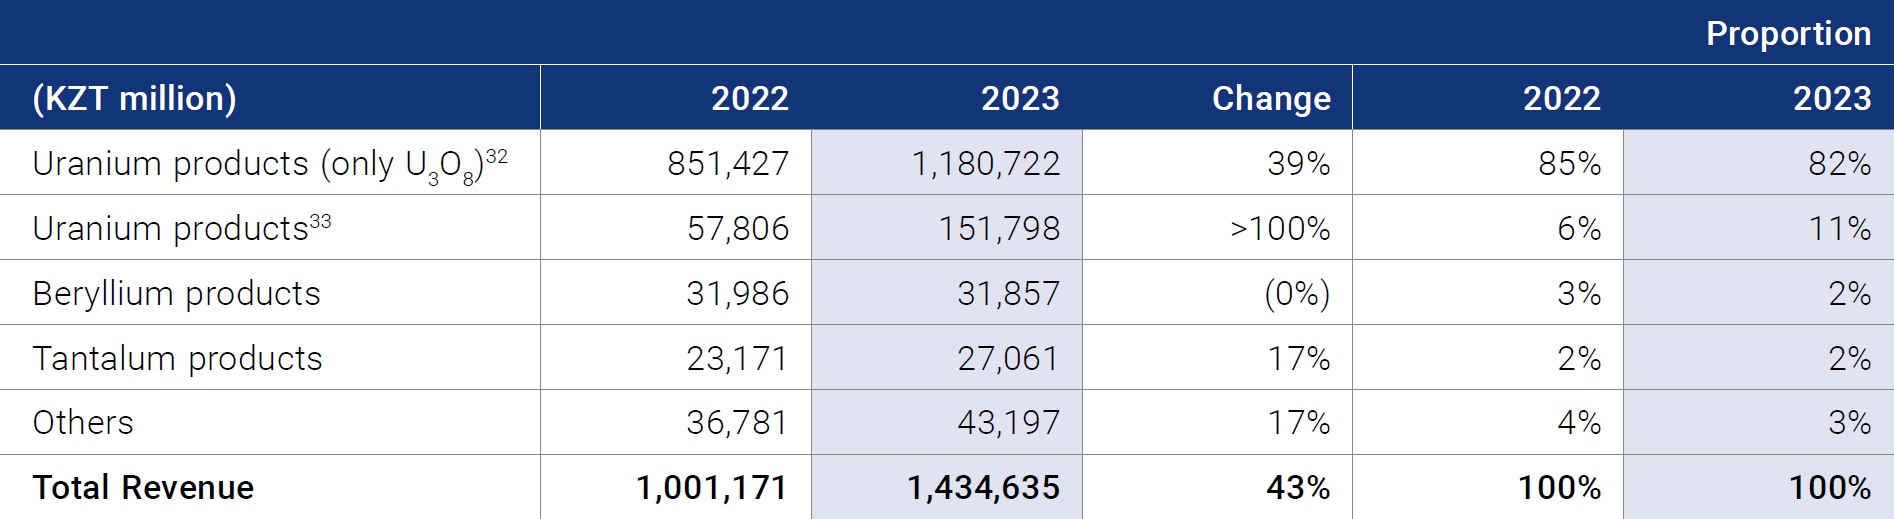
32 Includes only U3O8 sales proceeds (across the Group).
33 Includes, but is not limited to sale of EUP, UF6, production and sales of UO2 powder and fuel pellets by “UMP” JSC.
Operating profit in 2023 was KZT 680,812 million, an increase of 49% compared to 2022 (2022: KZT 455,962 million). The increase was mainly due to an increase in revenue in 2023 as indicated above.
In 2023 other loss amounted to KZT 50,855 million (in 2022, other income was KZT 38,667 million). This is primarily due to revaluation expense under a short-term inventory loan agreement between the Group and ANU Energy OEIC totalling KZT 37,977 million, which is due to be returned until March 2024. Additionally, a 100% provision on the overdue amount of KZT 15,692 million was accrued due to difficulties with the payments from Dioxitek S.A. (Argentina), due to new import legislative requirements introduced by the government of Argentina. The Group expects difficulties with the payments from Dioxitek S. A., debt repayment negotiations are ongoing.
Net profit in 2023 amounted to KZT 580,335 million, an increase of 23% compared to 2022 (in 2022 was KZT 472,963 million). The increase was mainly due to a higher operating profit in 2023 as indicated above.
Profit for the period attributable to non-controlling interest increased significantly in 2023 and comprised KZT 161,151 million due to a growth of net profit of the mining subsidiaries that have non-controlling interest, driven by an increase in the average realized price due to an increase in the spot price for U3O8, and an increase of sales volumes to second participants of the subsidiaries in question.
Adjusted EBITDA comprised KZT 828,623 million in 2023, an increase of 31% compared to 2022 (in 2022 was KZT 630,898 million), while attributable EBITDA was KZT 639,407 million in 2023, an increase of 29% compared to 2022 (2022: KZT 495,357 million). The changes were mainly driven by higher operating profit on consolidated level, higher EBITDA of JVs and associates, and growth in the average realized price associated with an increase in the market spot price for U3O8.
Uranium Segment
URANIUM SEGMENT FINANCIAL METRICS
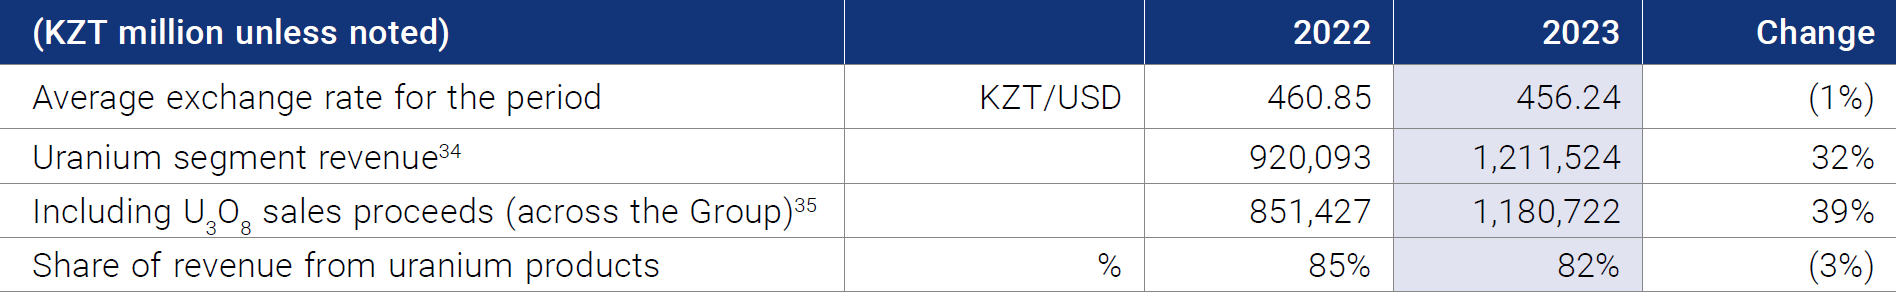
34 Calculated from Financial Statements Note “Segment Information” as a sum of external revenue and revenues from other segments for uranium segment.
35 Includes only U3O8 sales proceeds (across the Group).
Consolidated U3O8 sales were KZT 1,180,722 million in 2023, an increase of 39% compared to 2022 (in 2022 was KZT 851,427 million) was due to:
- the growth in the average realized price associated with an increase in the market spot price for U3O8;
- the increase in sales volume of U3O8 (see Section Uranium segment production and sales metrics) mainly related to additional requests from customers, as well as some new long-term contracts.
URANIUM SEGMENT PRODUCTION AND SALES METRICS
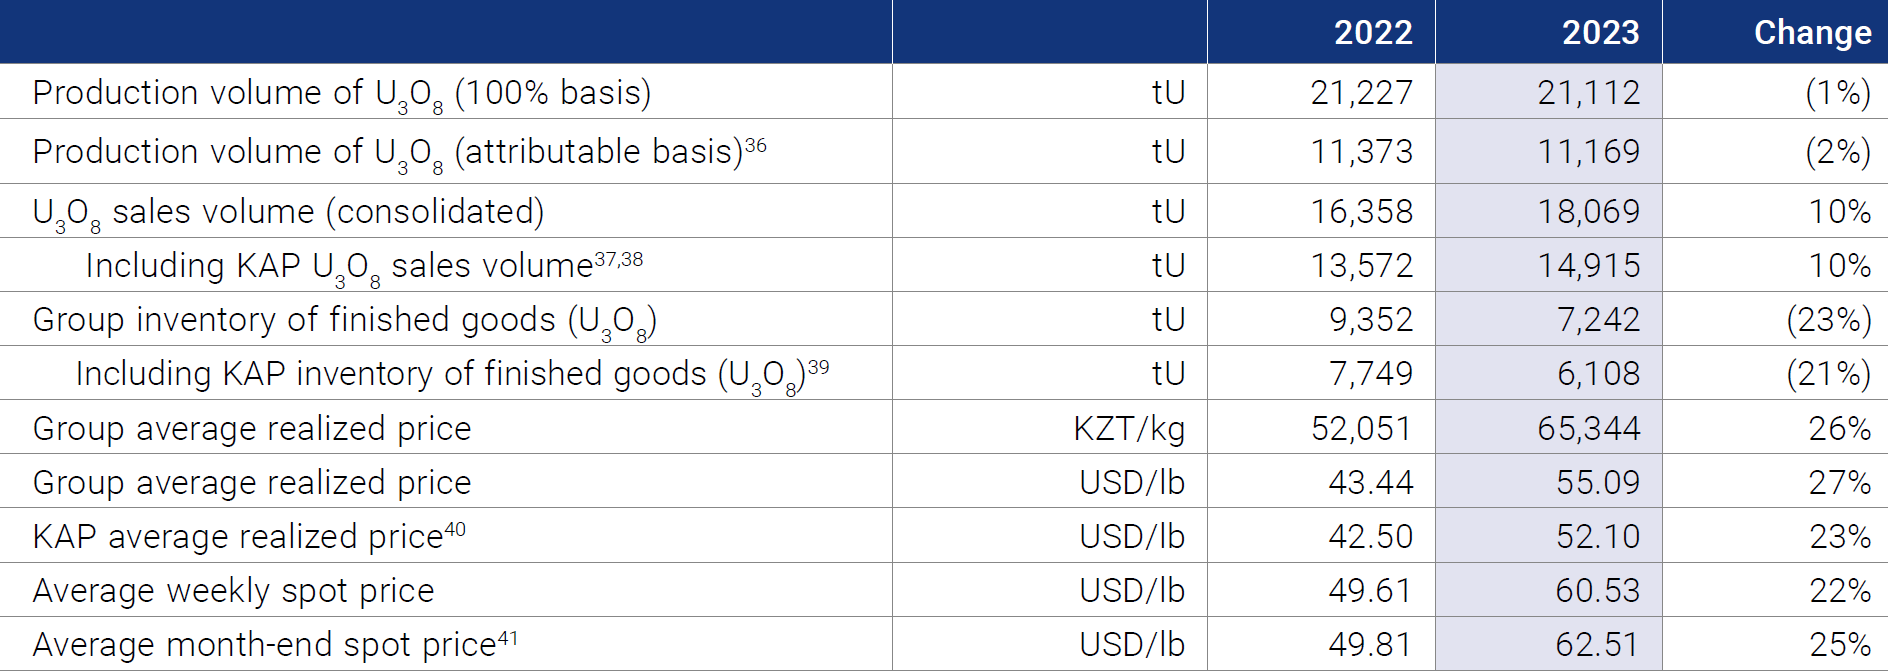
36 The Production volumes of U3O8 (attributable basis) is not equal to the volumes purchased by Company and THK in the Section Transactions with Subsidiaries, JVs, JOs and Associates.
37 KAP U3O8 sales volume (incl. in Group): includes only the total external sales of KAP HQ and THK. Intercompany transactions between KAP HQ and THK are not included Yet, some part of Group U3O8 production goes to the production of EUP, fuel pellets and fuel assemblies (FA) at Ulba-FA LLP.
38 Group sales volume and KAP sales volume (incl. in Group) does not include approximately 1,300 tonnes of natural uranium equivalent used for supply of EUP in 2023 for the project of “Ulba-FA” LLP.
39 KAP inventory of finished goods (incl. in Group): includes the inventories of KAP HQ and THK.
40 KAP average realized price: the weighted average price per pound for the total external sales of KAP and THK. The pricing of intercompany transactions between KAP and THK are not included.
41 Source: UxC, TradeTech. Values provided represent the average of the uranium spot prices quoted at month end, and not the average of each weekly quoted spot price, as contract price terms generally refer to a month-end price.
All annual operational and sales results in the uranium segment were in line with the updated guidance provided for 2023.
2023 production volumes on both a 100% and ownership basis were lower compared to 2022 due to a slight decrease in 2023 production plan compared to 2022.
In 2023, both Group and KAP sales volumes were higher compared to 2022, primarily due to additional requests from customers to flex up their annual delivery quantities within the frame of existing contracts, as well as some new long-term contracts with the delivery in a prompt window during 2023.
Sales volumes may vary substantially each period based on timing of customer delivery requests during the year and terms of physical delivery activity.
Consolidated Group inventory of finished U3O8 products amounted to 7,242 tonnes as at 31 December 2023, which was 23% lower than at 31 December 2022. At the KAP HQ and THK level, inventory of finished U3O8 products was 6,108 tonnes which was 21% lower than at 31 December 2022. Overall, the decrease in inventory is attributed to the increased sales volume.
The Group’s average realized price in KZT in the 2023 was KZT 65,344 per kg (55.09 USD/lb), an increase of 26% compared to 2022 due to an increase in the average spot price for uranium products.
The average sales prices at the KAP level were also higher and for the same reasons.
The Company’s current overall contract portfolio price is correlated to uranium spot prices (see Section Uranium sales price sensitivity analysis). The increase in average realized prices in 2023 was comparable to the increase in the spot market price for uranium. For short-term deliveries to end-user utilities, the spot price can vary between the time contract pricing is established according to Kazakh transfer pricing regulations, and the spot price in the general market when the actual delivery takes place. The impact of market volatility during the time lag between pricesetting and delivery becomes more pronounced as volatility increases, in both rising and falling market conditions. At the same time, pricing mechanisms for some long-term contracts include fixed basic price components that were set in lower price conditions.
URANIUM SEGMENT PRODUCTION BY OPERATION
The information presented in the table below provides the total uranium production level at each asset (100% basis). The impact of delays and/or limited access to some key materials & equipment in 2023 and 2022 (see Sections Cost and availability of sulphuric acid and Inflation-related costs, as well as availability of critical operating materials & equipment), was not equal across all operations due to the nature of the ISR mining process, and differences in the mine plans and development phase at each operation.
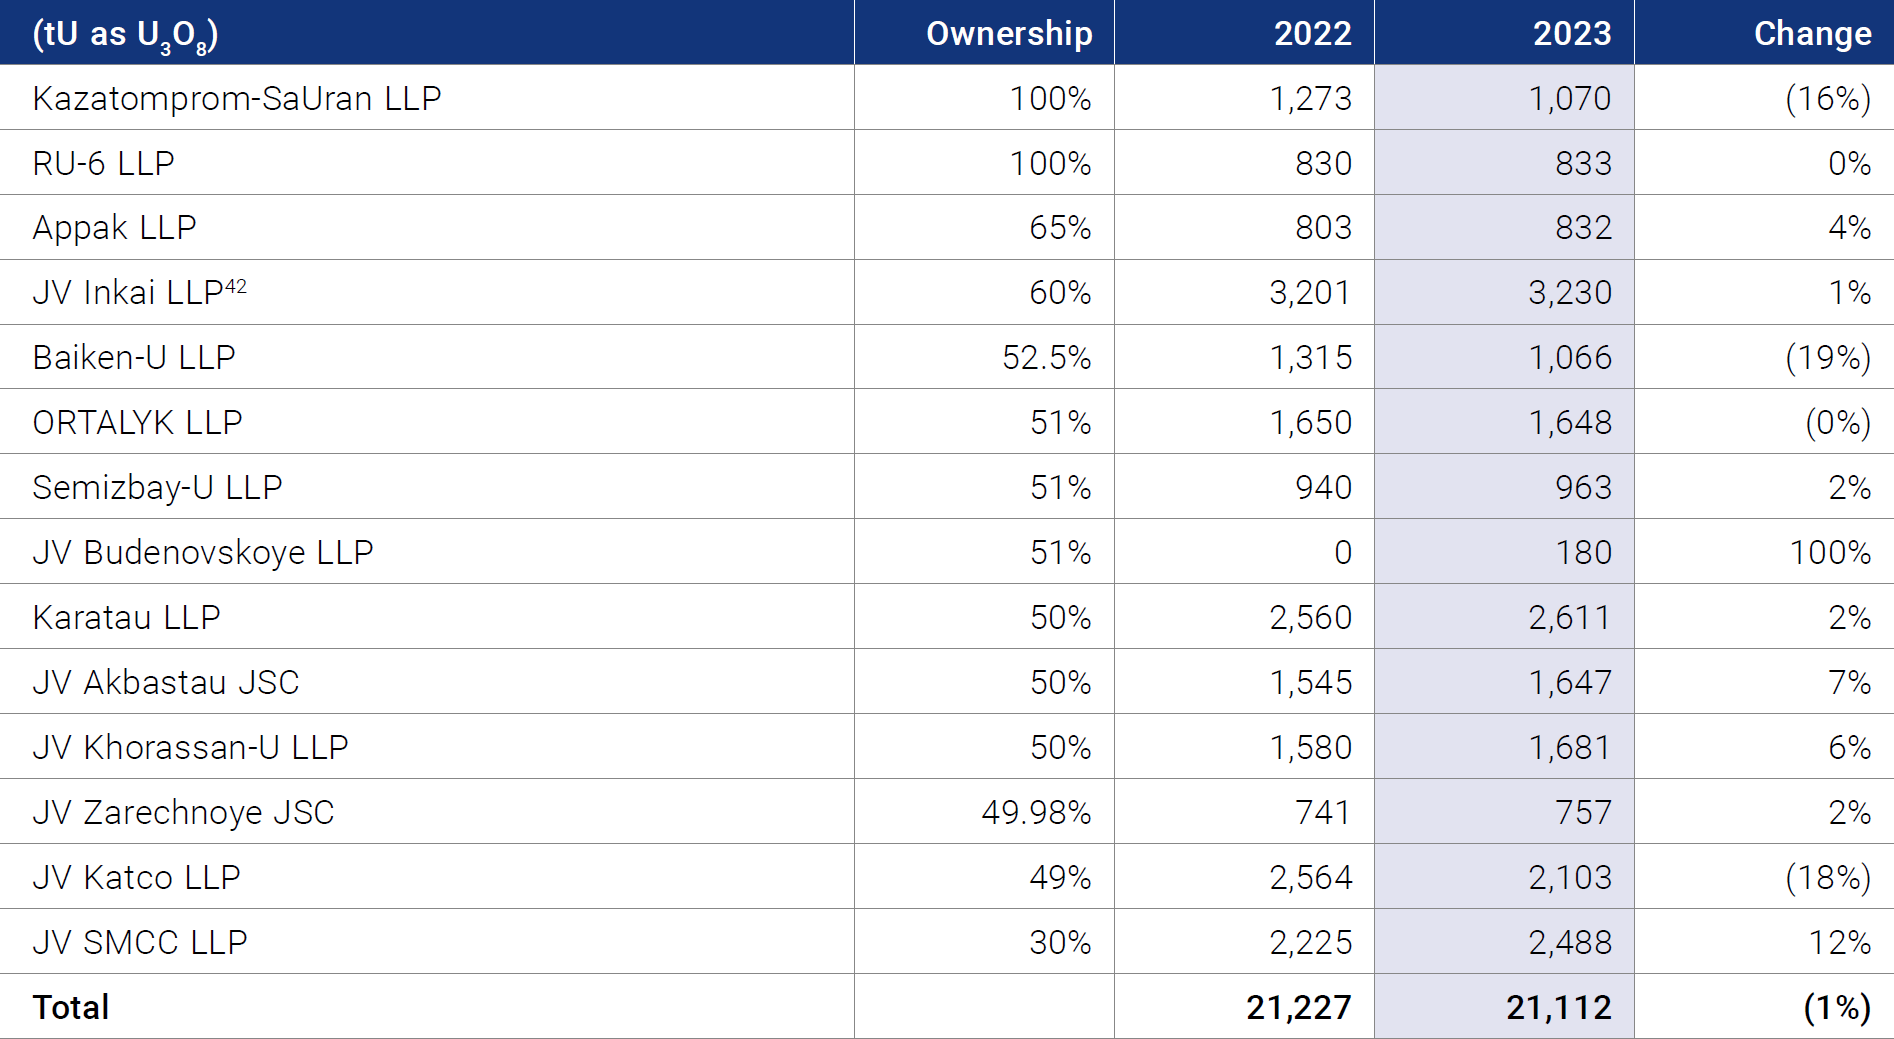
42 For JV Inkai LLP annual share of production on attributable basis is determined as per Implementation Agreement as disclosed in IPO Prospectus. Company’s annual attributable share of production in 2023 comprised 1,615 tU (2022: 1,600 tU).
UMP Segment
UMP SEGMENT URANIUM PRODUCT SALES
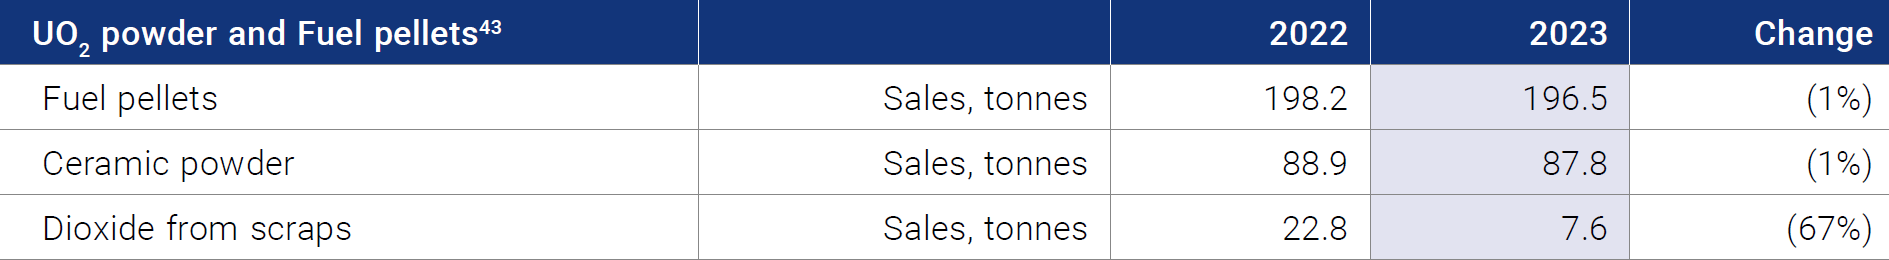
43 Includes sales volumes of products and materials sold through tolling services.
Sales volumes of fuel pellets, including material produced under tolling services, in 2023 were 196.5 tonnes, and ceramic powders were 87.8 tonnes, which corresponds to the volumes of 2022 and is related to contracted sales volumes in accordance with customer demand. A 67% reduction in sales volumes of dioxide from scraps to 7.6 tonnes in 2023 occurred in accordance with the volume of supply of raw materials for processing from the customer.
UMP SEGMENT RARE METAL PRODUCT SALES
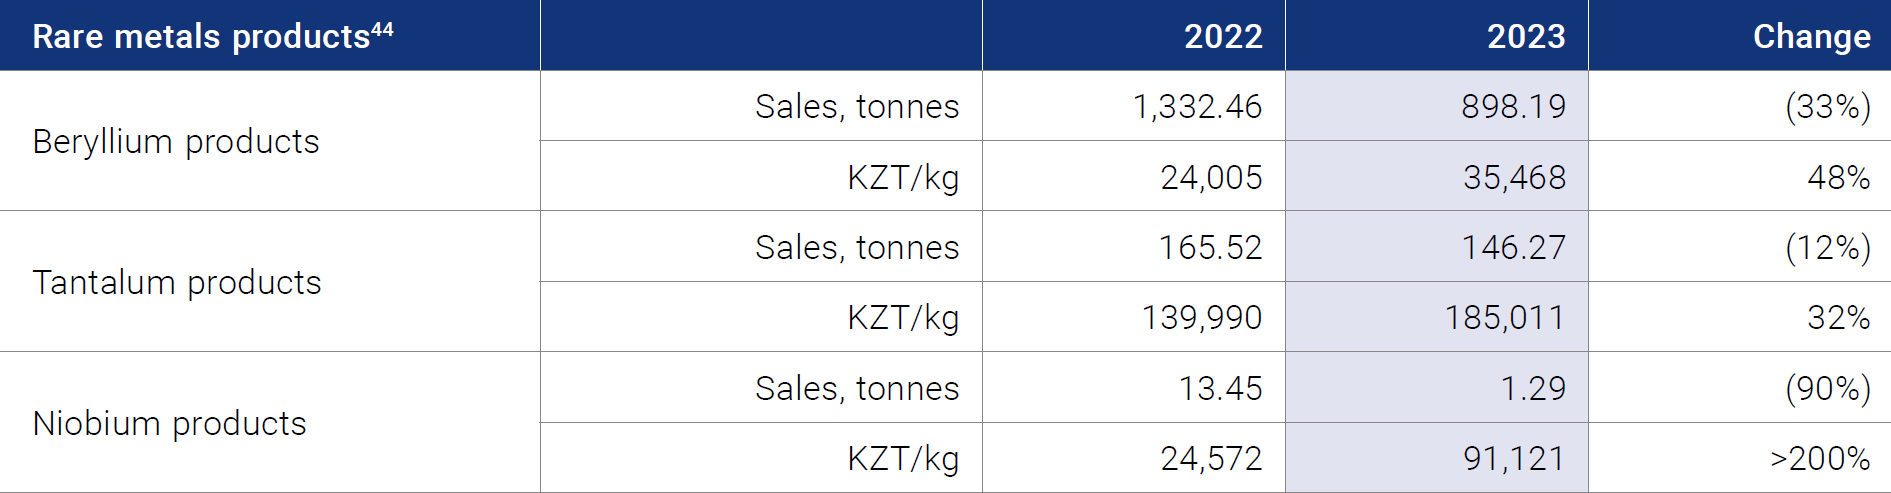
44 Includes sales volumes of products and materials sold through tolling services.
Sales volume of beryllium products decreased by 33% in 2023 compared to 2022. Sales price increased by 48% in 2023 mainly due to change in the product mix to higher value-added refined products.
Sales volume of tantalum products decreased by 12% compared to 2022 due to lower customer demand. Sales prices for tantalum products increased by 32% due to a change in the structure of products sold towards an increase in the share of more high-tech and expensive products (rolled products and powders).
Sales volume of niobium, including tolling services significantly decreased in 2023 compared to 2022, due to lower demand, whereas sales prices for niobium products in 2023 increased compared to the same period in 2022 due to changes in product mix of the realized products.
Due to the expiration of the contract for fluorite extraction at the Karadzhal deposit in April 2022, UMP JSC suspended fluorite mining operations. Since February 2024, following the acquisition of a new extraction contract, fluorite mining operations have resumed. However, during this period, the production of fluorspar concentrate continued uninterrupted, as processing of previously mined mineral resources was ongoing.
Cost of Sales
The table below illustrates the components of the Group’s cost of sales for 2023 and 2022:

Cost of sales totalled KZT 671,862 million in 2023, an increase of 41% compared to 2022 (in 2022 was KZT 475,097 million) mainly due to higher production cost for uranium produced by consolidated subsidiaries and JOs, higher cost for purchased uranium (described below) as well as increased sales volume of U3O8 in 2023.
The cost of materials and supplies was KZT 364,841 million in 2023, an increase of 39% compared to 2022 (in 2022 was KZT 261,825 million) due to an increase in the cost of sales of uranium purchased from JVs and associates, as well as from third parties (when such uranium is sold, the cost of sales is predominantly represented by the cost of purchased materials and supplies at the prevailing spot price with certain applicable discounts). The growth of cost of materials and supplies also was due to an increase of purchase price of materials and supplies, including U3O8 as a result of inflationary pressure and an increase in the spot prices.
Depreciation and amortization totalled KZT 92,824 million in 2023, an increase of 17% compared to 2022 (in 2022 was KZT 79,037 million), mainly due to higher sales volume of consolidated subsidiaries and JOs’ produced uranium, as well as an increase in the costs of repayment of the PGR (see Section Capital expenditures review).
The cost of processing and other services was KZT 71,126 million in 2023, significantly increased compared to 2022 (in 2022 was KZT 31,361 million), mainly due to an increase in a volume of U3O8 processed for a production of Ulba-FA LLP.
Payroll costs totalled KZT 61,886 million in 2023, an increase of 25% compared to 2022 (in 2022 was KZT 49,348 million), mainly due to a higher sales volume of consolidated subsidiaries and JOs’ produced material. The increase was also associated with a lagged effect from standardisation of remuneration across the Group that was introduced in prior periods.
The taxes other than income tax totalled KZT 55,868 million, which is comprised mostly of MET, increased by 25% compared to 2022 (in 2022 was KZT 32,216 million) due to an increase in spot prices as per formula mentioned in Section Taxation and Mineral Extraction Tax (“MET”) as well as an increase in the sales volume of uranium produced by consolidated subsidiaries.
The other categories of costs, including items such as maintenance and repair, transportation and other expenses totalled KZT 25,317 million in 2023 (in 2022 was KZT 21,310 million), an increase of 19% compared to 2022 mainly due to inflationary pressure.
URANIUM SEGMENT C1 CASH COST, ALL-IN SUSTAINING CASH COST, AND CAPITAL EXPENDITURES
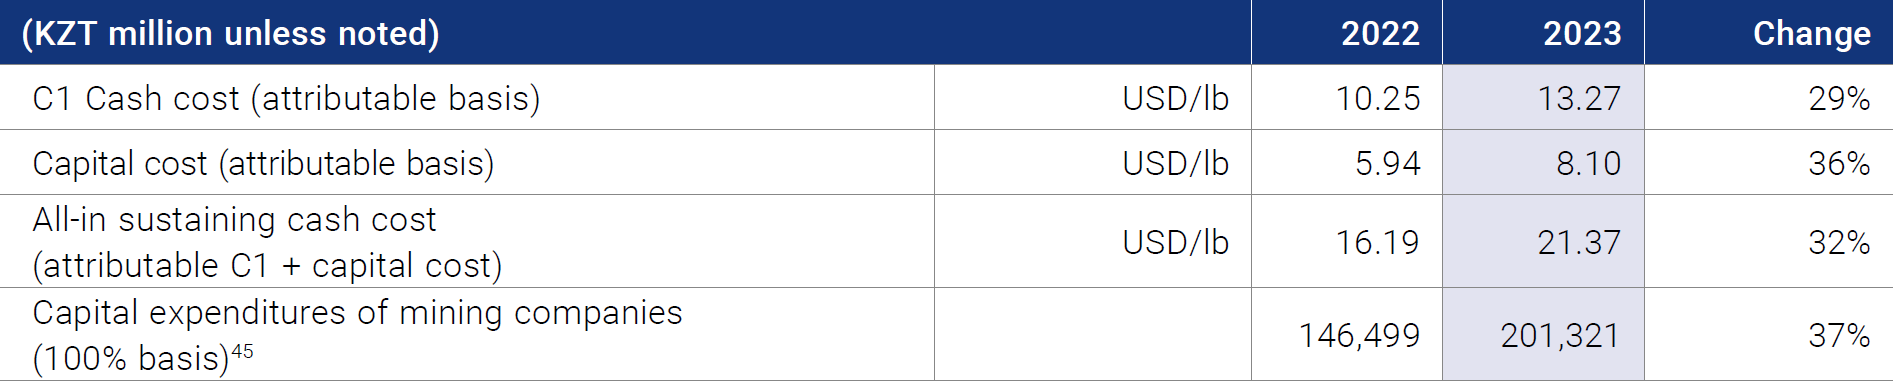
45 Excludes liquidation funds and closure costs. Note that in Section Capital Expenditures Review total results include liquidation funds and closure cost.
C1 Cash cost (attributable) increased by 29% and All-insustaining cash costs (AISC) (attributable C1 + capital cost) increased by 32% in USD equivalent for 2023 compared to 2022. The increase in C1 Cash cost was primarily due to an increase in the MET tax expenses related to its changes introduced from 2023, see Section Taxation and Mineral Extraction Tax (“MET”), as well as increase in wages and salaries of the production personnel and inflationary pressure on services, certain materials and reagents.
AISC increased due to an overall increase in capital cost on an attributable basis.
Capital expenditures of mining companies (100% basis) in 2023 totalled KZT 201,321 million, an increase of 37% compared to 2022 (in 2022 was 146,499 million), primarily due to a shift in wellfield development activities, as well as a rise in purchase prices for materials, supplies, equipment and cost of drilling (see Section Capital expenditures review).
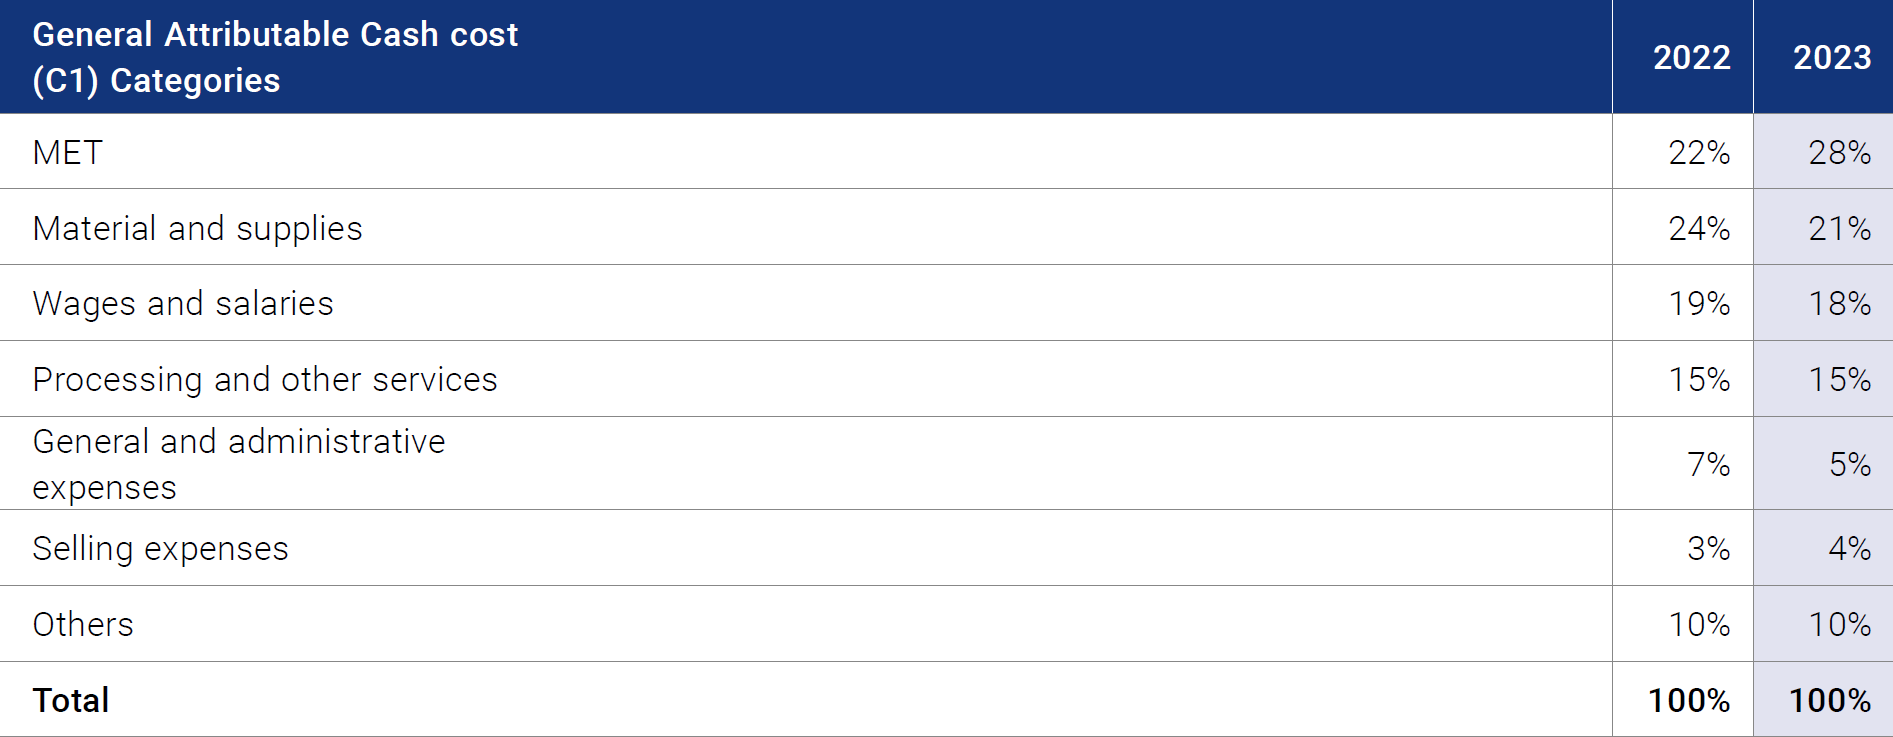
Kazatomprom’s attributable C1 cash cost categories are generally broken down as follows (proportions vary year-to-year, and vary between operations, deposits and regions):
Selling Expenses
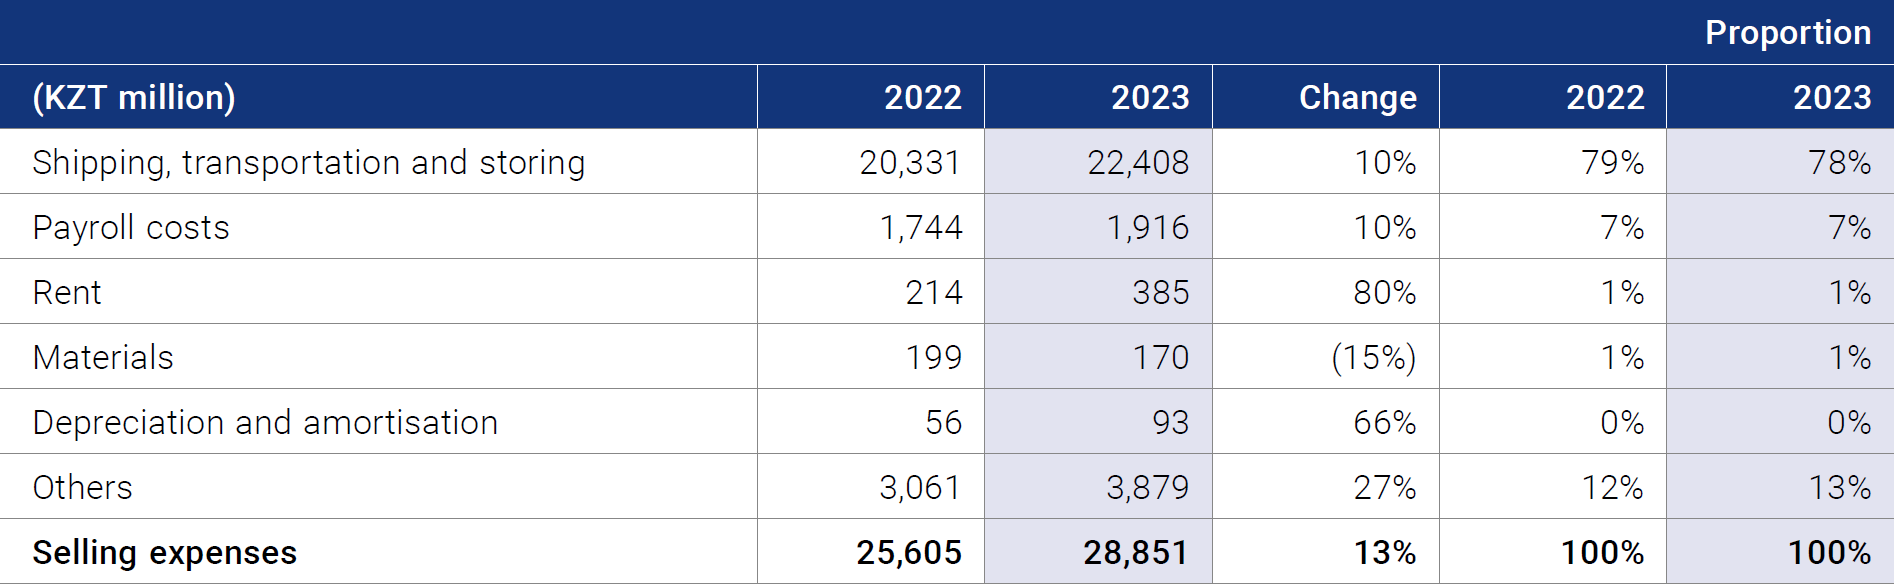
Selling expenses totalled KZT 28,851 million in 2023 and significantly increased compared to 2022. The increase is mainly due to an increase in sales volume and as well as higher volumes shipped using the TITR (see Section Sales).
General & Administrative Expenses (G&A)
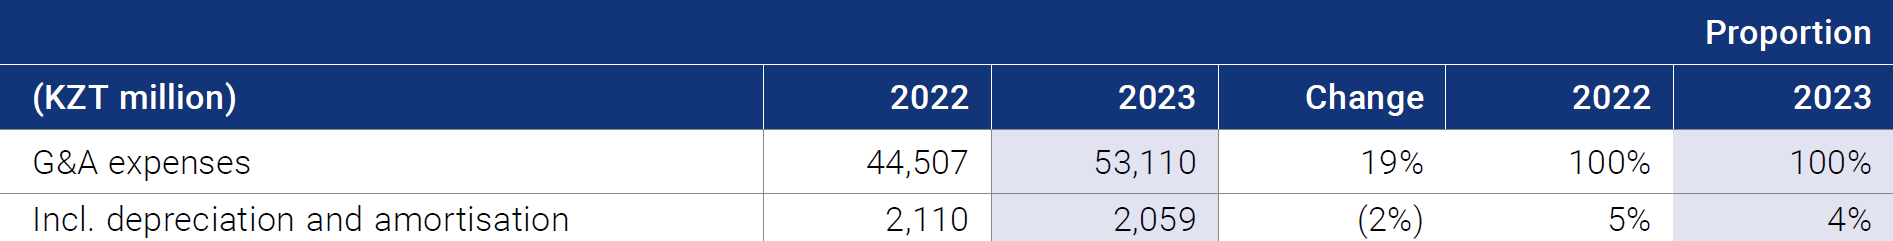
The increase in G&A expenses includes compensation paid to the government in the amount of KZT 11,357 million and a provision for the payment of compensation to the second participant of MC Ortalyk LLP, in the amount of KZT 4,679 million as explained below.
In October 2017, the Group obtained a Contract for uranium exploration at Zhalpak field for a period up to 31 May 2018. In May 2018, the Ministry of Energy of the Republic of Kazakhstan agreed to extend the exploration period under the Contract until 31 December 2022 for mineral resource assessment. However, the Project for Assessment Works was not approved by the Ministry of Energy of the Republic of Kazakhstan, therefore the pilot production stopped in April 2020. The volume of unauthorised uranium at the Zhalpak field for the period from June 2018 to April 2020 amounted to 162.45 tonnes. On 15 August 2023 MC Ortalyk LLP paid a compensation of KZT 11,404 million including exchange rate difference at the date of payment.
In relation to this payment the Company also has accrued a provision for payment of compensation to the second participant of MC Ortalyk LLP in the amount of KZT 4,679 million due to the potential possibility of paying compensation, depending on the applicability of certain conditions of the Sale and Purchase Agreement for a 49% share in the MC Ortalyk LLP, dated 2021.
In 2022 expenses included compensation to the government in the amount of KZT 7,310 million for overproduction by JV Akbastau JSC of 249 tonnes of uranium compared to its approved volumes under subsoil use agreement.
The Share of Associates’ and JVs’ Results
The share of results of associates and JVs in 2023 was KZT 98,385 million, an increase of 10% compared to 2022 (in 2022 was KZT 89,076 million). The increase was related to a growth in the average realized price associated with an increase in the market spot price for U3O8, in 2023.

Profit Before Tax and Tax Expense
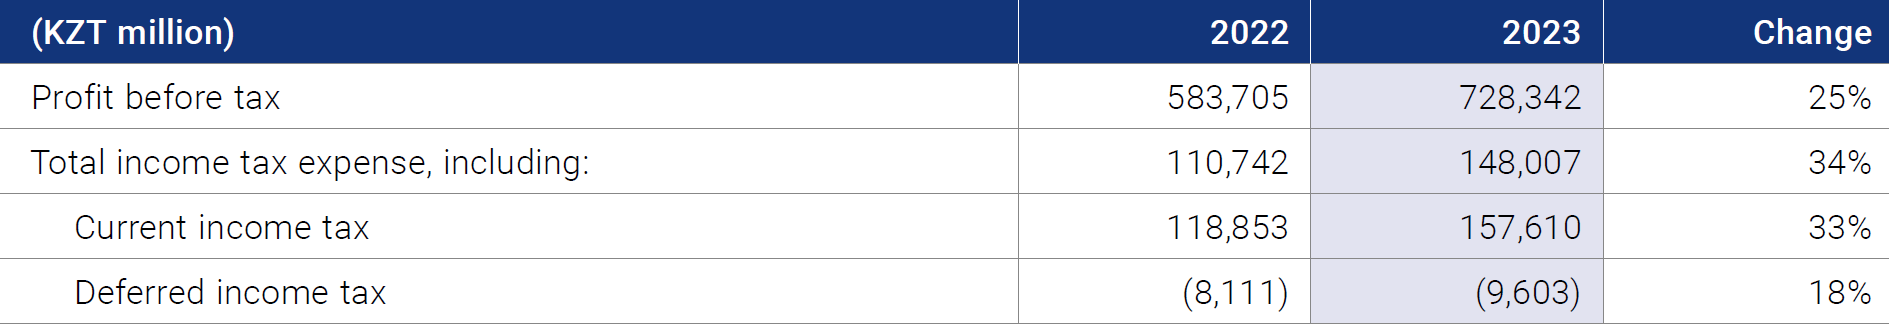
The Group’s profit before tax was KZT 728,342 million in 2023, significantly higher than in 2022 which is mainly due to increase in operating income driven by the growth in the average realized price with an increase in the market spot price for U3O8 as well as an increase in sales volume of U3O8 and uranium products.
In 2023, corporate income tax expense was KZT 148,007 million, a significant increase compared to 2022 (2022: KZT 110,742 million) related to the increased current income tax and increase in profit before tax in 2023.
The corporate tax rate applicable to the Group's profits was 20% in 2023 and 2022. Effective income tax rates were 20% and 19% for 2023 and 2022, respectively. The effective tax rate differs from the corporate income tax rate primarily due to certain elements of reported income and expenses that are not recognised in tax accounting. In general, the difference between the effective tax rate and the applicable Kazakhstani corporate tax rate of 20% is insignificant.
Capital Expenditures Review
Most capital expenditures of the Group are incurred by subsidiaries, JO’s, JVs and associates engaged in the mining of natural uranium. Such expenditures are comprised of the following key components:
- uranium well construction costs;
- expansion costs, which typically include expansion of processing facilities, the extension of services and transport routes to new wellfield areas, implementation of new systems and processes;
- sustaining capital, largely reflecting recurring, infrastructure, maintenance and equipment replacement related costs, which typically to cease three years prior to the end of production at the asset; and
- liquidation fund contributions and mine closure costs (not included in the calculation of AISC).
The following table provides the capital expenditures for the Group’s subsidiaries, JOs, JVs and associates engaged in uranium mining on the 100% basis for the periods indicated. Capital expenditure amounts shown were derived from stand-alone unaudited management information of certain entities within the Group based on a stand-alone account information of these entities, and they are therefore not comparable with or reconcilable to the amounts of additions to property, plant and equipment as presented in the Consolidated Financial Statements, therefore, investors are strongly advised not to place undue reliance on such capital expenditure information.
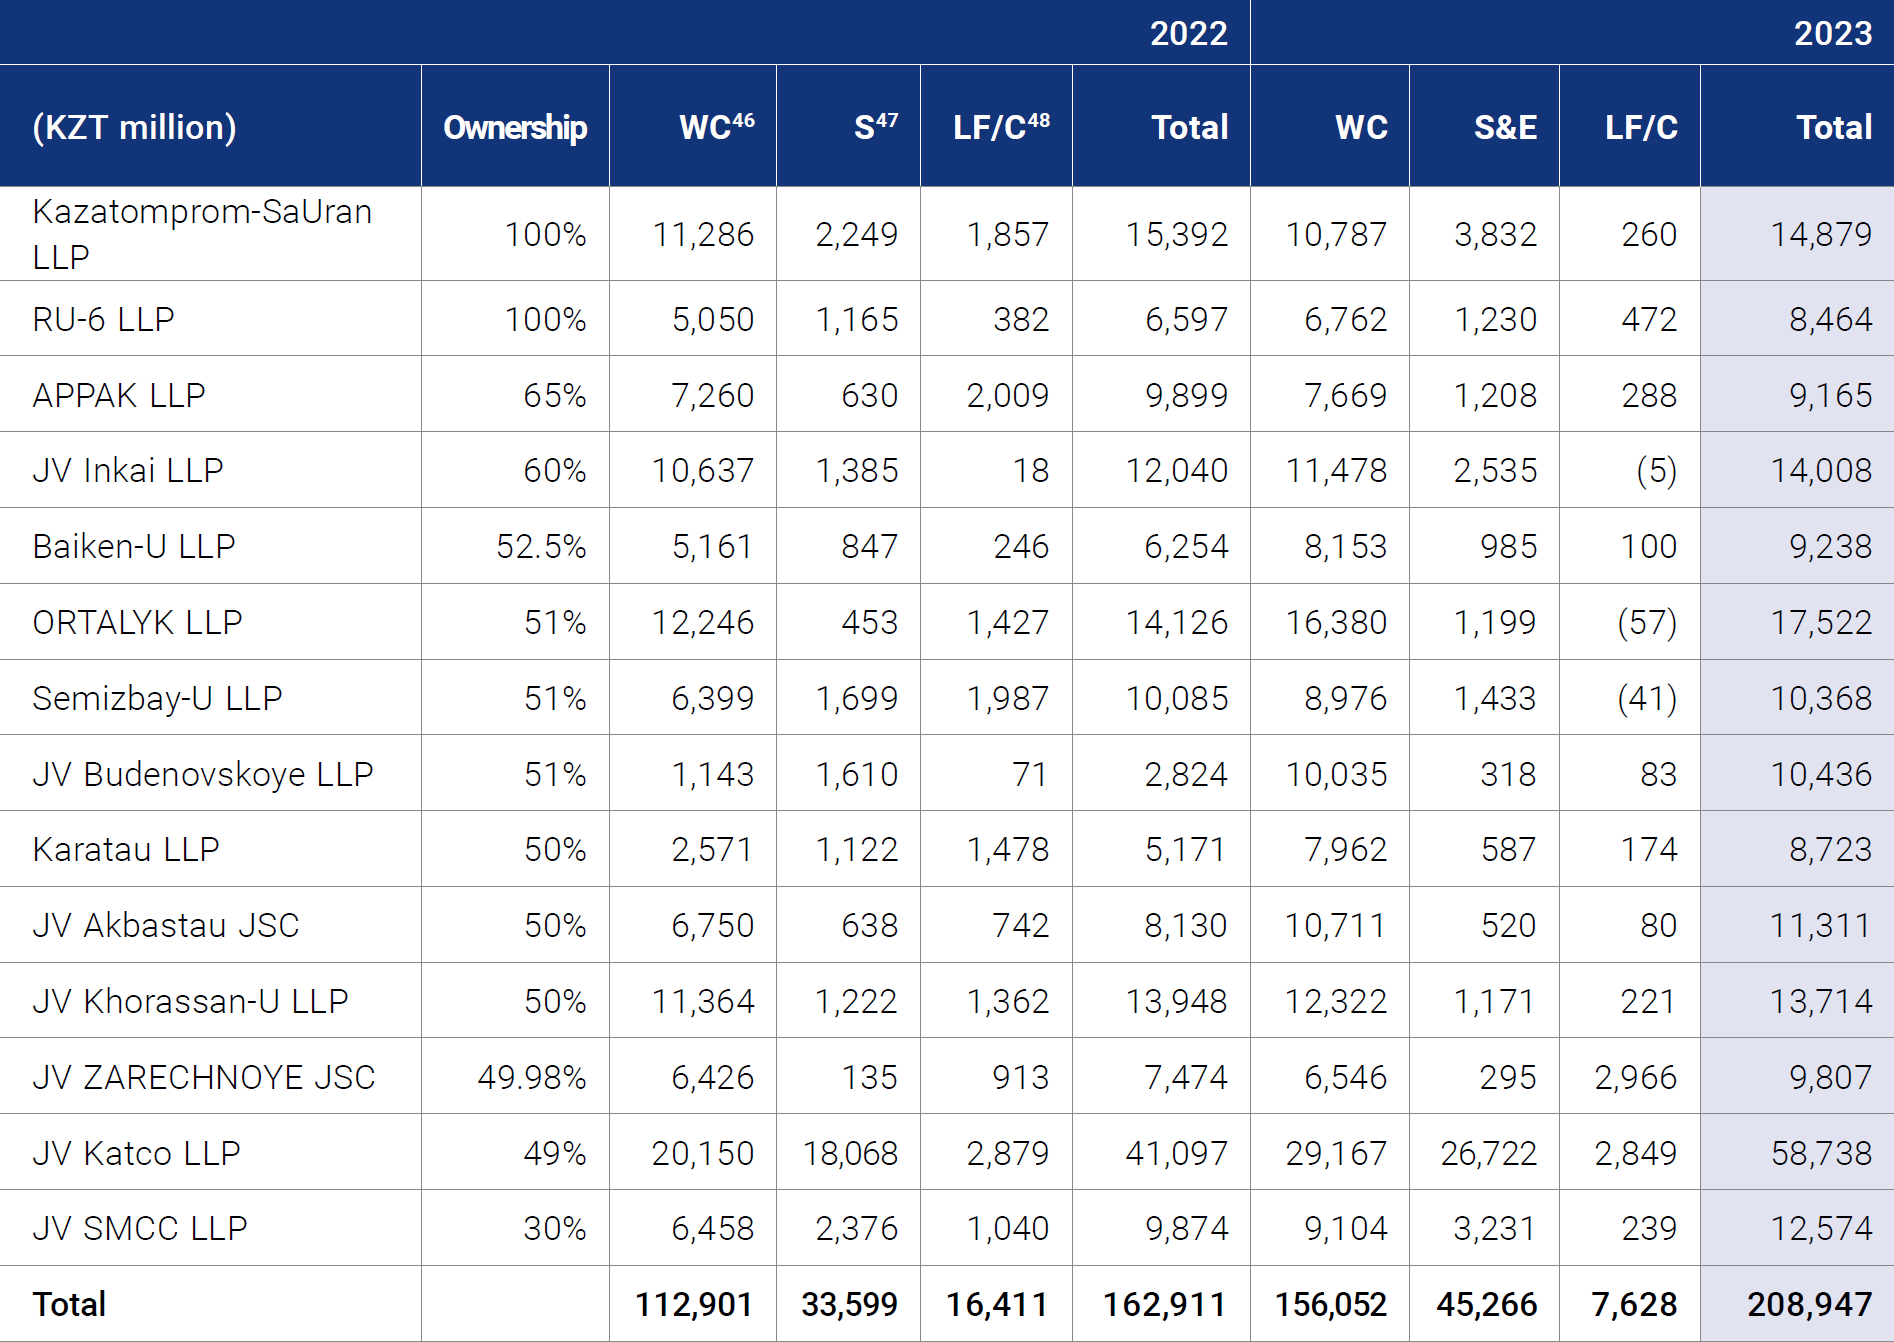
46 Well construction.
47 Sustaining. Includes total expansion investments.
48 Liquidation fund/closure.
In order to achieve the planned levels of production, the Group’s mining companies assess the required level of wellfield and mining preparation based on the availability of reserves. These costs relate to the capitalised costs of maintaining the sites, with the main component being wellfield construction.
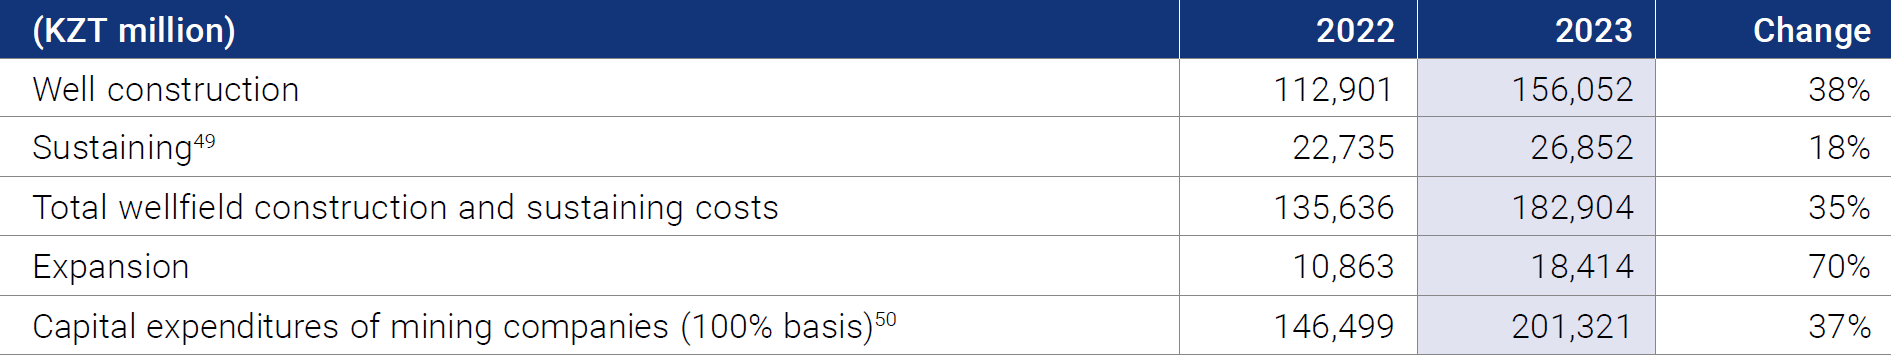
49 Excludes general expenses for expansion.
50 Excludes liquidation funds and closure costs.
The wellfield construction and sustaining costs for 14 mining entities in 2023 amounted to KZT 182,904 million, which significantly exceeds the results of 2022. This is due to the fulfilling the production plan for 2023 and reserves preparation for 2024, as well as inflationary pressure caused by the increase in procurement prices for raw materials, materials, equipment, and drilling services.
Total capital expenditures of mining companies in 2023 were in line with the updated guidance range provided for 2023 (KZT 200-210 billion), which contributed to the implementation of the production program for the reporting year.
The information presented in the table below reflects the wellfield development depreciation (commonly known as PGR), property, plant and equipment, and depreciation and amortization data for each mining asset in 2023.
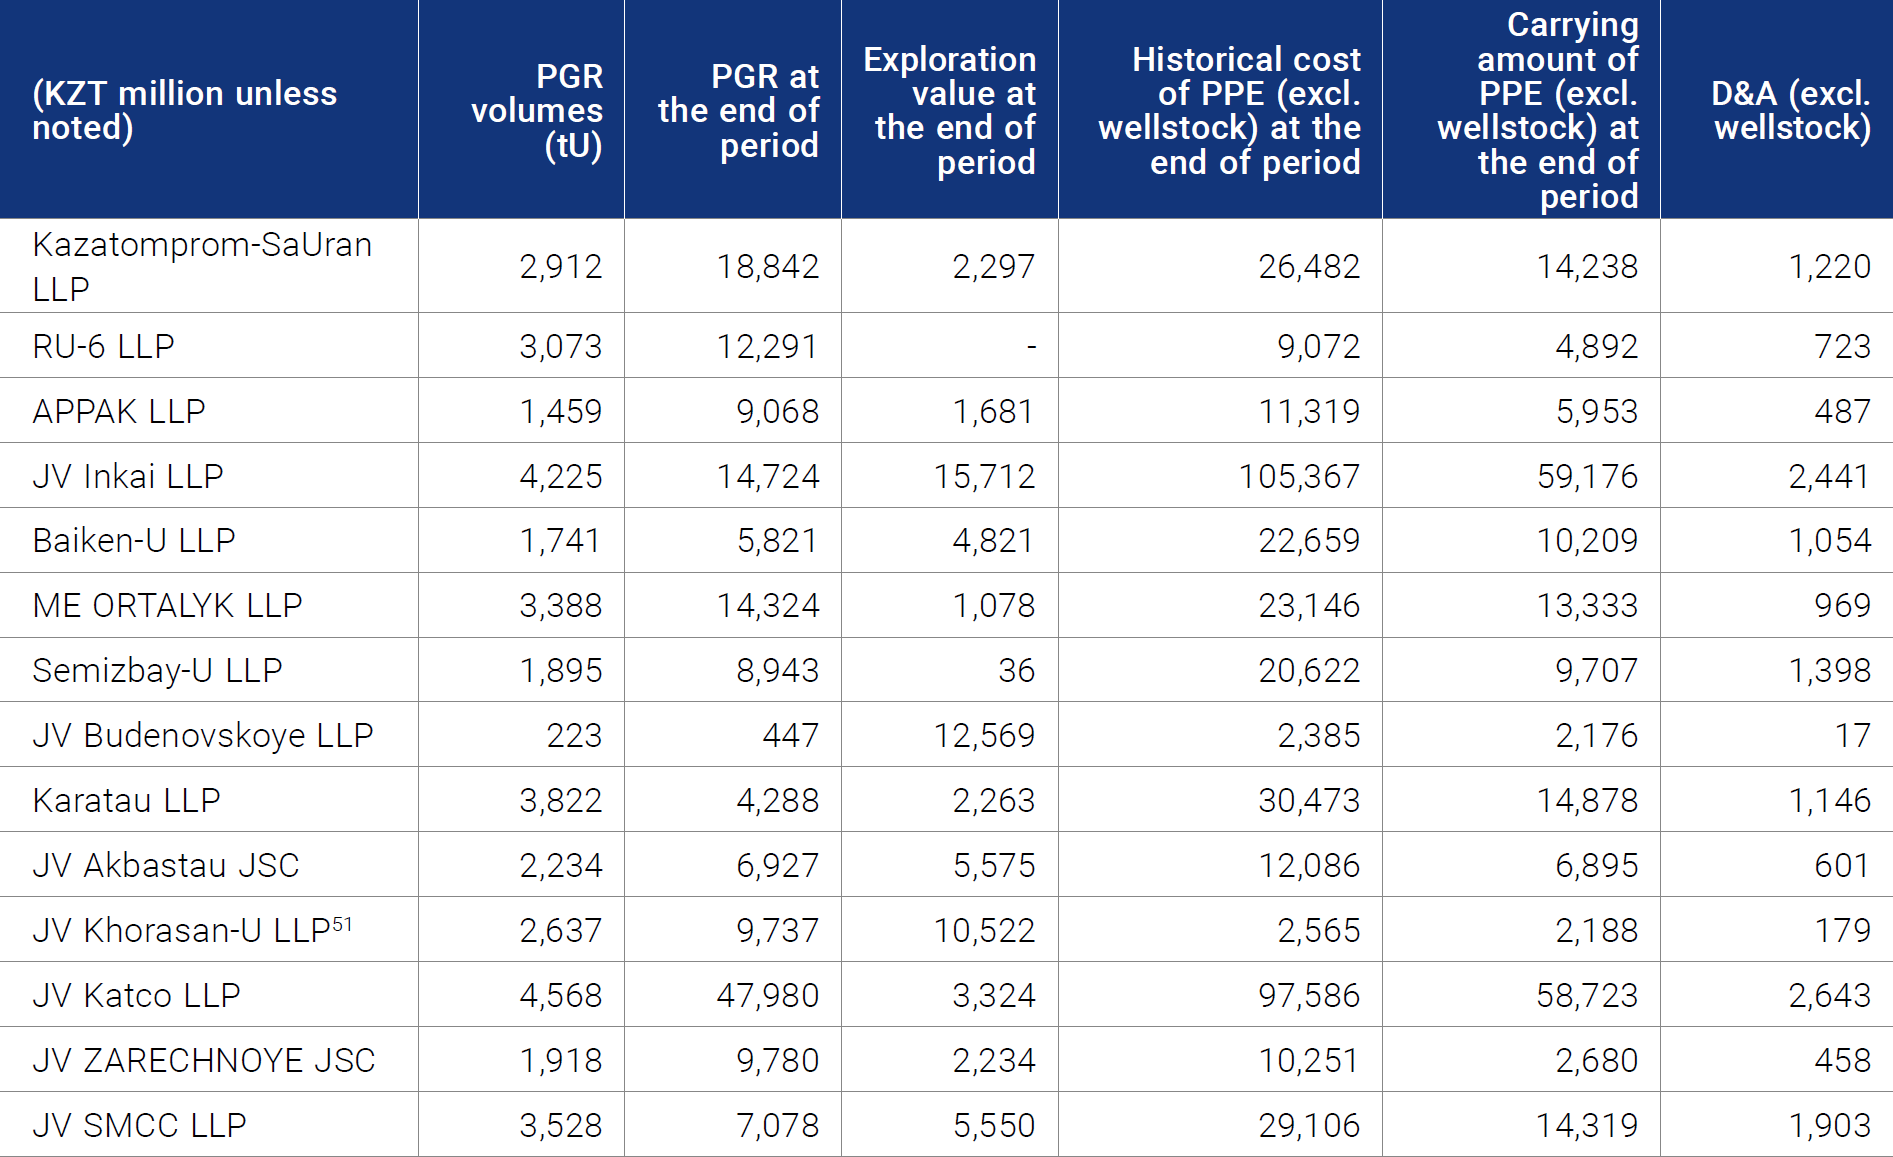
51 Includes the fixed assets of Kyzylkum LLP.
Reserves and Geological Surveys
Reserves and Resources, ('000 tU)
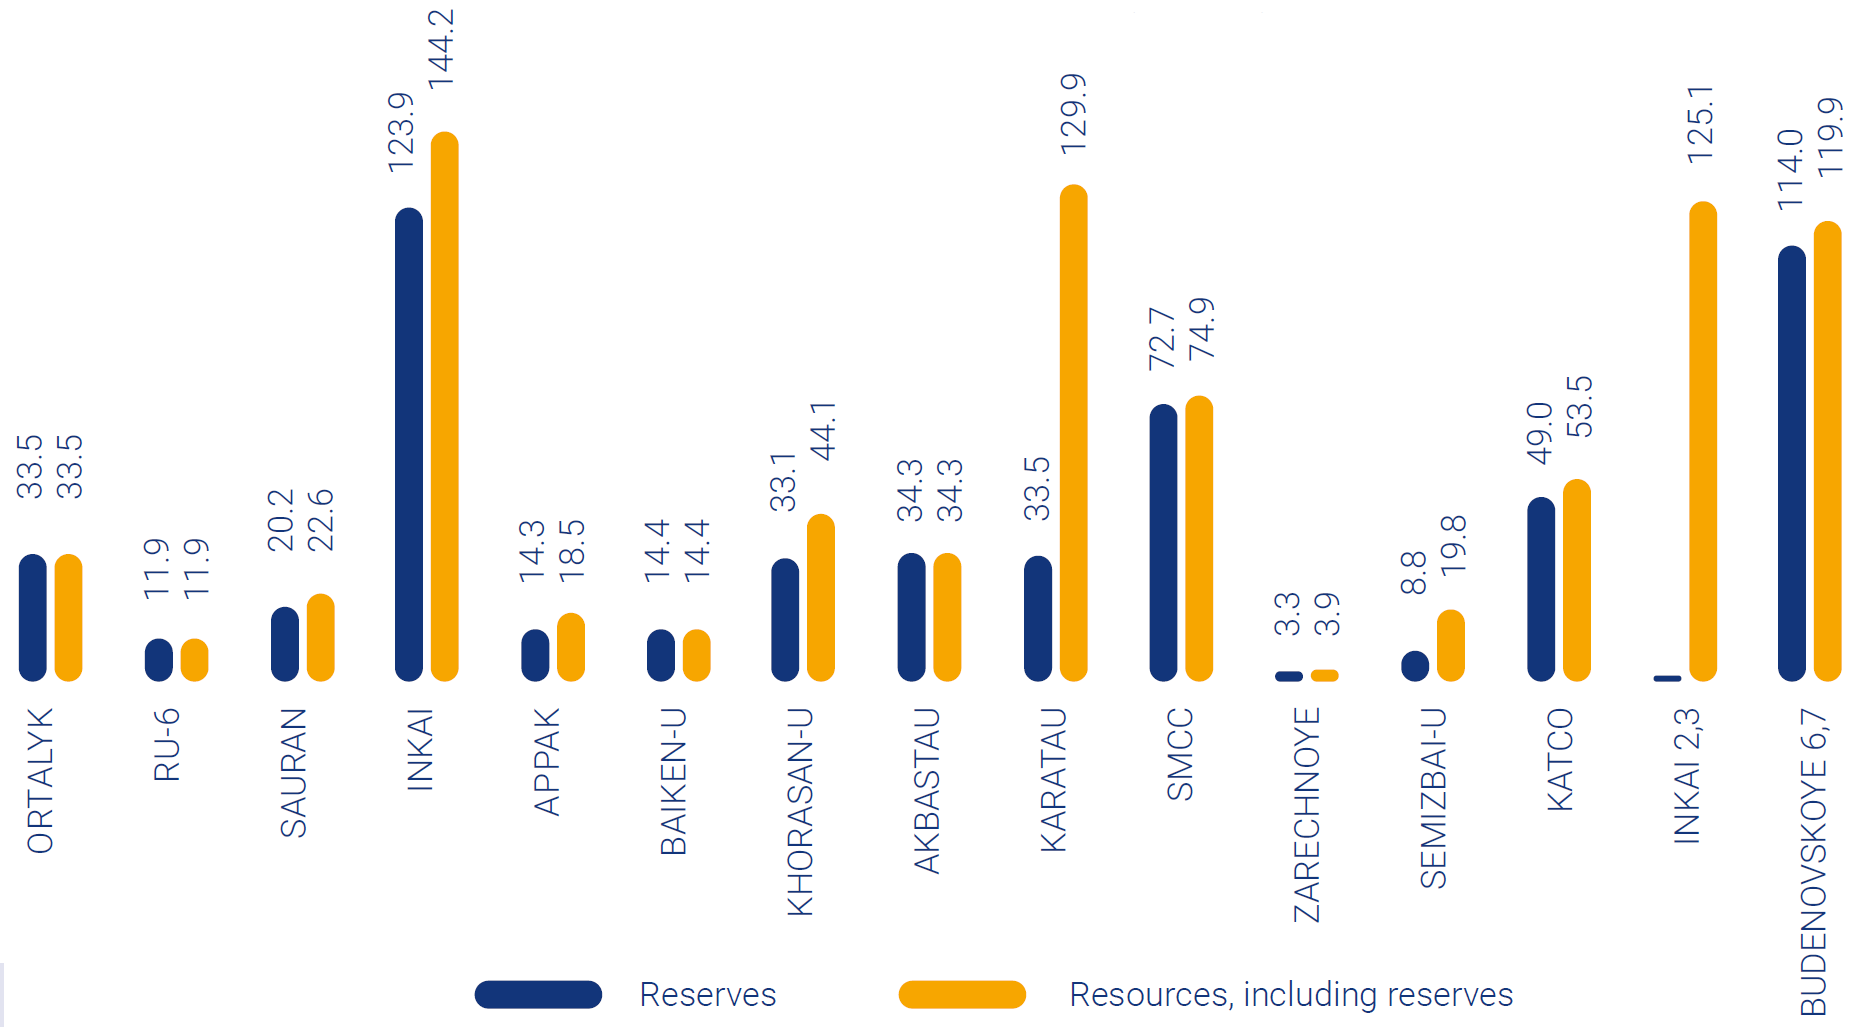
In accordance with the SRK Consulting (UK) Limited Letter (dated 16 January 2024), the Ore reserves of all mining assets as of 31 December 2023 (including annual depletion) totalled 566.9 thousand tU, (100% basis), with 300.9 thousand tU attributable (in 2022: 588.8 thousand tU on a 100% basis, 312.9 thousand tU attributable). Total mineral resources (including ore reserves) were estimated at 850.5 thousand tU (100% basis), with 508.9 thousand tU attributable to the Company (in 2022: 761.6 thousand tU on 100% basis, 464.8 thousand tU attributable). In comparison to 2022, total mineral resources increased by about 88.9 thousand tU, mainly due to the completion of work on the revaluation of uranium reserves at enterprises: Karatau LLP, Khorasan-U LLP and APPAK LLP, and including the depletion of deposits due to production in the amount of 21 thousand tU in 2023 on 100% basis. For more information, please see in a letter from SRK Consulting (UK) Limited about Mineral Resources and Ore Reserves, available in the "Investors" section on the Company's website.

Liquidity and Capital Sources
Kazatomprom’s management aims to preserve financial stability in a constantly changing market environment. The Group’s financial management policy is intended to maintain a strong capital base to support existing operations and business development.
The Group’s liquidity requirements primarily relate to funding working capital, capital expenditures, service of debt, and payment of dividends. The Group has historically relied primarily on cash flow from operating activities to fund its working capital and long-term capital requirements, and it expects to continue to do so, although it maintains the option to use external financial resources when required. It is expected that there will be no significant change in the sources of the Group’s liquidity in the foreseeable future. If required, the Company will consider entering into project financing arrangements to fund certain investment projects.
CASH AND AVAILABLE SOURCE OF FINANCING
The Group manages its liquidity requirements to ensure the continued availability of cash sufficient to meet its obligations on time, avoid unacceptable losses, and settle its financial obligations without jeopardizing its reputation.
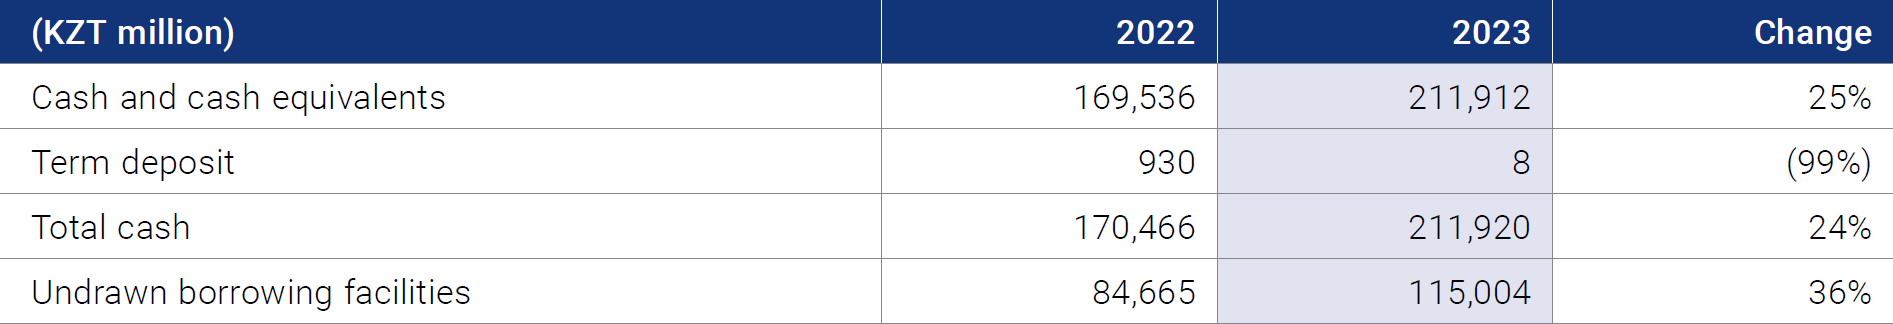
Total cash at 31 December 2023 comprised KZT 211,920 million, compared to KZT 170,466 million at 31 December 2022, due to explanations that are presented below in the Section Cash Flows.
Undrawn borrowing facilities are the revolving corporate credit lines available to the Group and are considered as an additional short-term liquidity source to cover temporary cash deficit related to uneven receipts of trade receivables.
As of 31 December 2023, the total limit on the Group's revolving credit lines was USD 253 million, which was fully available for use at the Company’s discretion (as of 31 December 2022, the limit on revolving credit lines was USD 235 million).
DIVIDENDS RECEIVED AND PAID
The Company is the parent for the Group, and in addition to revenue from its business operations, it receives dividends from JVs and associates, and from other investments. In 2023 and 2022, the Group received dividends of KZT 87,794 million and KZT 45,346 million, respectively, from its JVs and associates, and from other investments. The increase in 2023 is mainly due to increase in the operating results of joint ventures and associates, and other investments as well as due to a growth of dividends received from JV KATCO LLP and related compensation received from the second participant for the additional 11% from distributable annual profit. The Company balances dividend maximisation and sustainable development goals at subsidiaries, JVs and associates. Dividends received by the Company from investees domiciled in the Republic of Kazakhstan are exempt from dividend tax.
In 2023, the Company announced dividends of KZT 200,970 million which was paid to shareholders in July 2023 based upon the results of 2022 operations (KZT 227,388 million was paid to the shareholders in July 2022 based upon the results of 2021 operations).
WORKING CAPITAL
The table below provides a breakdown of the Group’s working capital in 2023 and 2022.
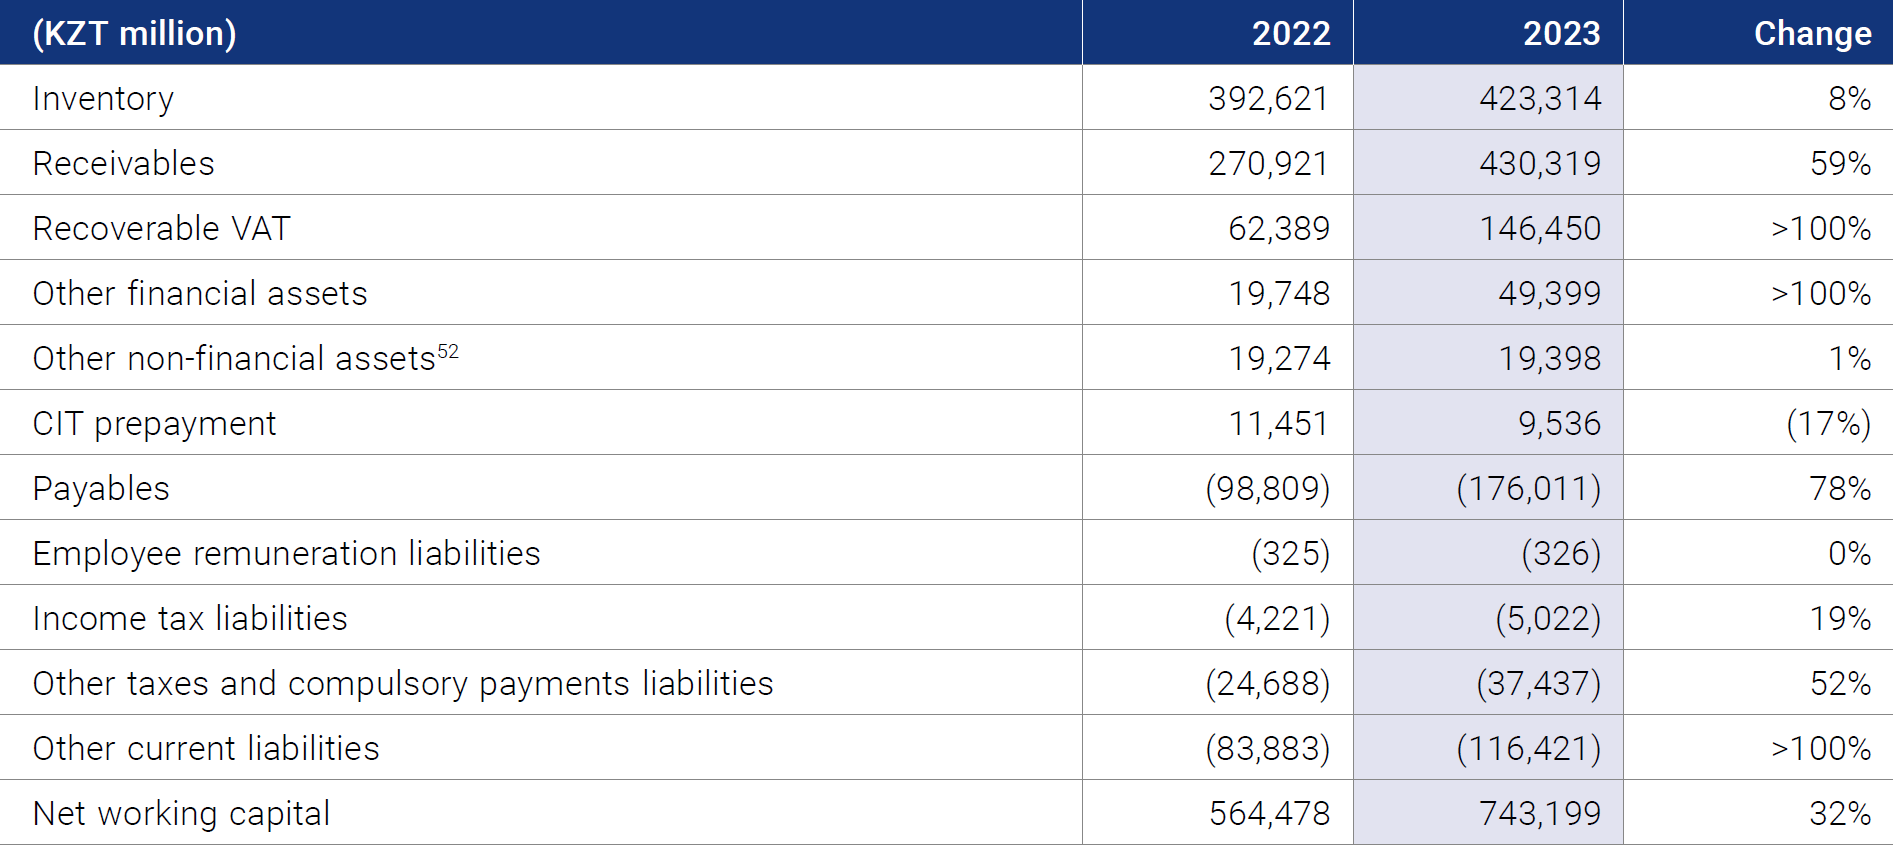
52Excludes term deposits in amount of KZT 8 million in 2023 (2022: KZT 930 million) as these deemed as equivalent to cash (see Section Cash and available source of financing).
An increase in receivables was mainly due to the growth of revenues in 2023 (see Section Consolidated revenue and other financial metrics).
Recoverable VAT significantly increased and comprised KZT 146,450 million due to increase in cost of uranium purchased by the Company from its subsidiaries, JOs, JVs and associates which is associated with the increase of the market spot prices (see Section Transactions with subsidiaries, JVs, JOs and Associates).
As of 31 December 2023, other financial assets mainly represent the Group's investments in short-term debt securities issued by the National Bank of the Republic of Kazakhstan, the U.S. Department of the Treasury, and foreign commercial banks. As at 31 December 2023, these investments amounted to KZT 46,276 million.
As of 31 December 2023, other current liabilities include liabilities under a short-term inventory loan agreement of uranium for KZT 91,151 million (revalued at a fair value), concluded between the Group and ANU Energy with return period until March 2024.
Uranium loans are part of the Group’s normal inventory management policy, required to mitigate logistical risks that could affect the timely delivery of Kazakhstani uranium to Western conversion enterprises due to the current unstable geopolitical situation.
The Group’s net working capital remained positive during all periods under review.
The following table sets forth the components of the Group’s inventories in 2023 and 2022:
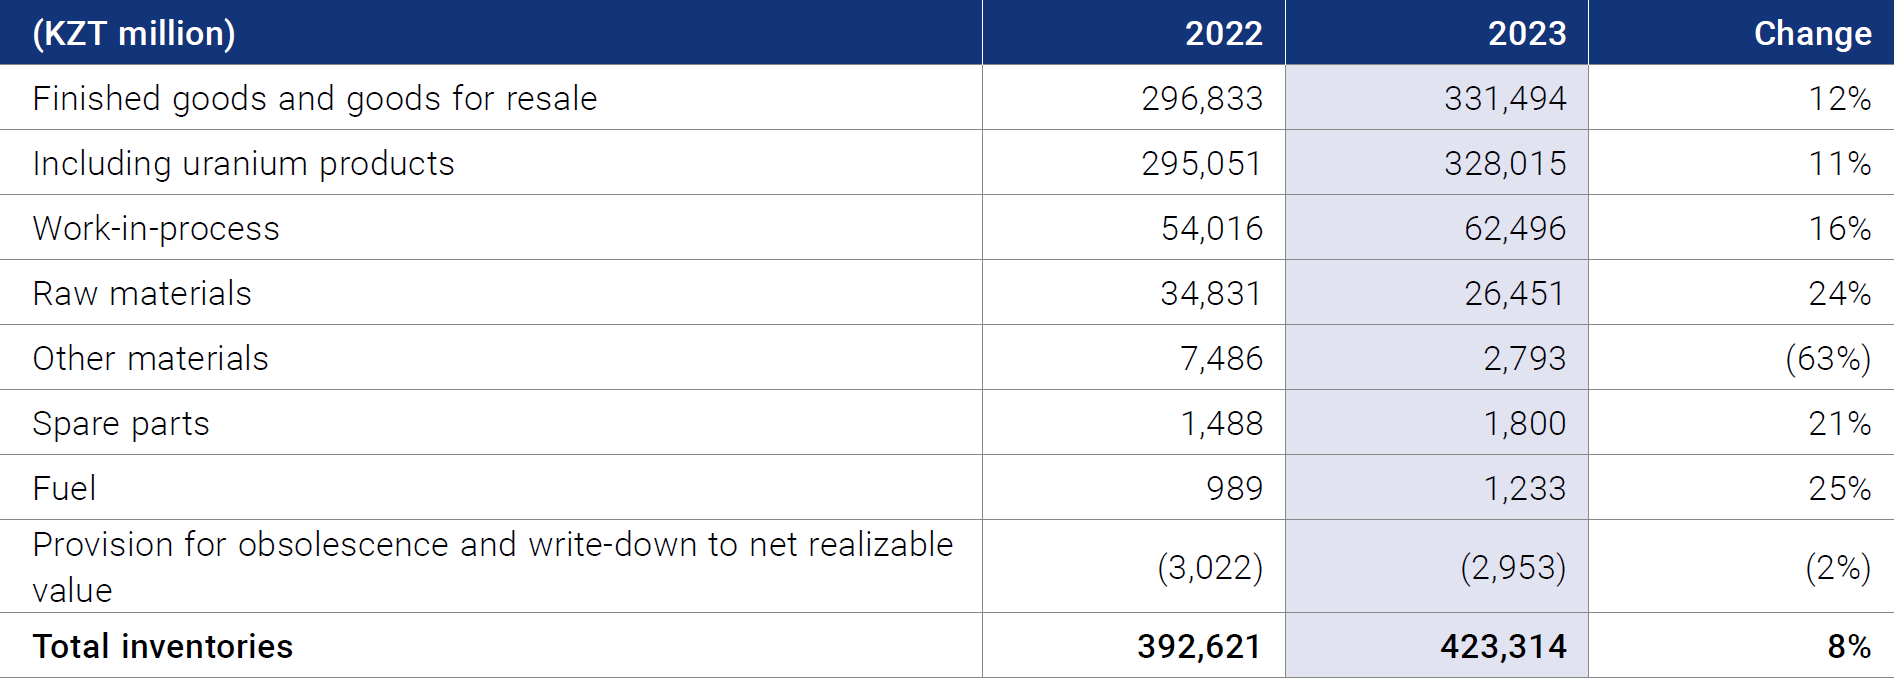
The Group constantly monitors the uranium market and may pursue a strategy of increasing its inventories in certain market conditions.
The Group’s largest inventory item is finished goods and goods for resale, which primarily consists of U3O8 and other uranium products.
An increase in inventory balance was mainly due to an increase in spot price of U3O8 during 2023, which increased the cost of purchased uranium from JVs, associates and third parties, along with the increase in a cost of finished goods. In alignment with the Company’s value strategy, Kazatomprom’s inventory levels vary based upon timing of customer requirements and the resulting differences in the timing of deliveries, and mining and sales volumes, in alignment with changing market conditions.
CASH FLOWS
The following cash flow discussion is based on, and should be read in conjunction with the Financial Statements and related notes.
The following table provides the Group’s consolidated cash flows in 2023 and 2022:
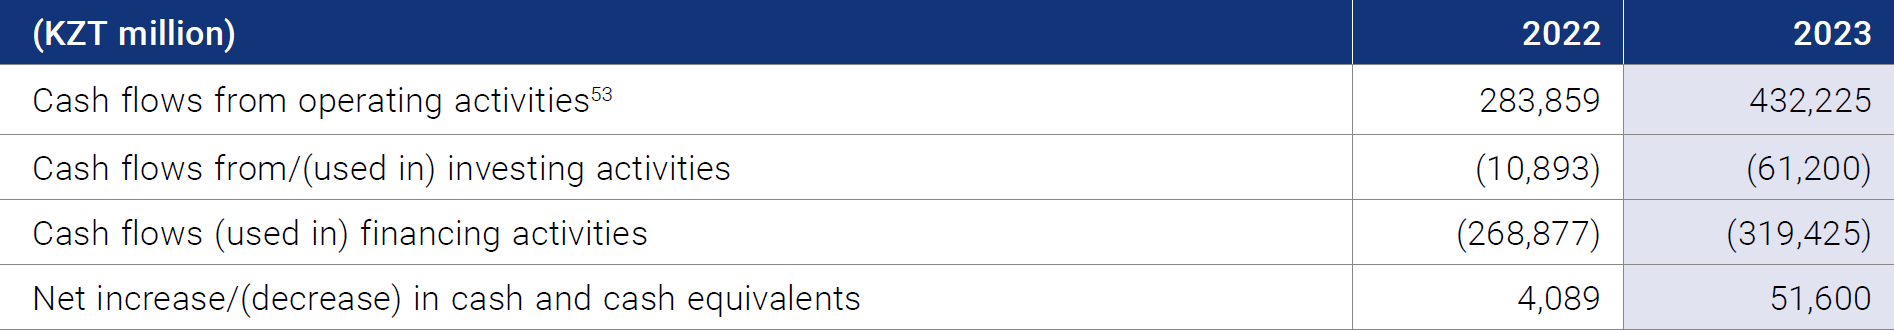
53 Includes income tax and interest paid.
CASH FLOWS FROM OPERATING ACTIVITIES
Operating cash flows in 2023 totalled KZT 432,225 million, a significant increase compared to 2022 KZT 283,859 million during the same period of 2022 mainly due to:
- a KZT 246,449 million increase in cash receipts from customers and under swap transactions during 2023 compared to 2022, due to growth in the average realized price associated with an increase in the market spot price for U3O8, as well as increase in the sales volume and change in timing of sales schedule;
- offset by a KZT 50,546 million decrease in 2023 inflows from VAT refunds from the budget;
- offset by KZT 39,573 million due to an increase in other taxes paid, primarily from the higher amount of accrued value-added tax resulting from an increase in intra-group sales within the territory of Republic of Kazakhstan, along with an in increase in the mineral extraction tax;
- a KZT 28,667 million increase in income tax paid due to the increase in profit before tax (see Section Profit before tax and tax expense).
CASH FLOWS FROM INVESTING ACTIVITIES
Net cash outflows from investing activities were KZT 61,200 million in 2023 compared to outflows KZT 10,893 million in 2022.
Changes in investing cash flows in 2023 were due to:
- a KZT 42,448 million increase in 2023 in dividends received from associates, joint ventures and other investments (see Section Dividends received and paid);
- an increase in investments for the purchase of debt securities issued by the US Department of the Treasury and the Eurasian Development Bank, net of the amount – KZT 41,249 million;
- an increase in acquisition of property, plant and equipment, acquisition of mine development assets and acquisition of exploration and evaluation assets in sum for KZT 35,283 million primarily due to a shift in wellfield development activities, as well as higher purchase prices for equipment (see Section Capital Expenditures Review).
CASH FLOWS FROM FINANCING ACTIVITIES
Net cash outflows from financing activities were KZT 319,425 million in 2023 and KZT 268,877 million in 2022.
The principal factors affecting the comparable cash flows used in financial activities was:
- an increase in the net of cash outflow from proceeds and repayment of loans and borrowings totalling KZT 95,517 million;
- offset by a decrease in the payment of dividends paid to shareholders and dividends paid to noncontrolling interests by KZT 26,418 and 18,422 million, respectively.
Indebtedness
The total debt and guarantees of the Group as of 31 December 2023 were KZT 102,473 million (KZT 157,381 million in 2022).
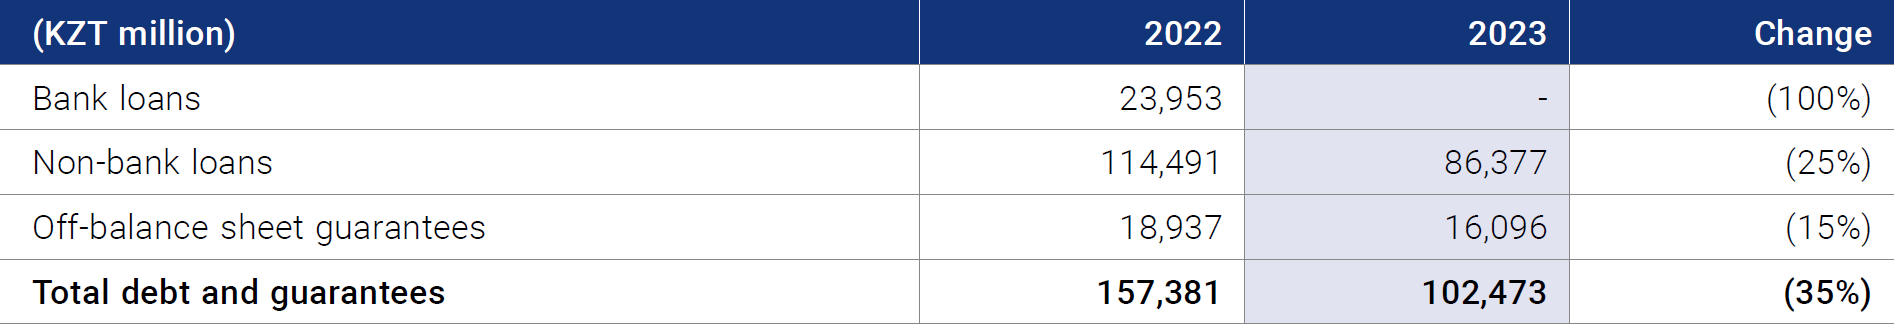
The following table summarises the Group’s debt for the years ended 31 December 2023 and 2022:
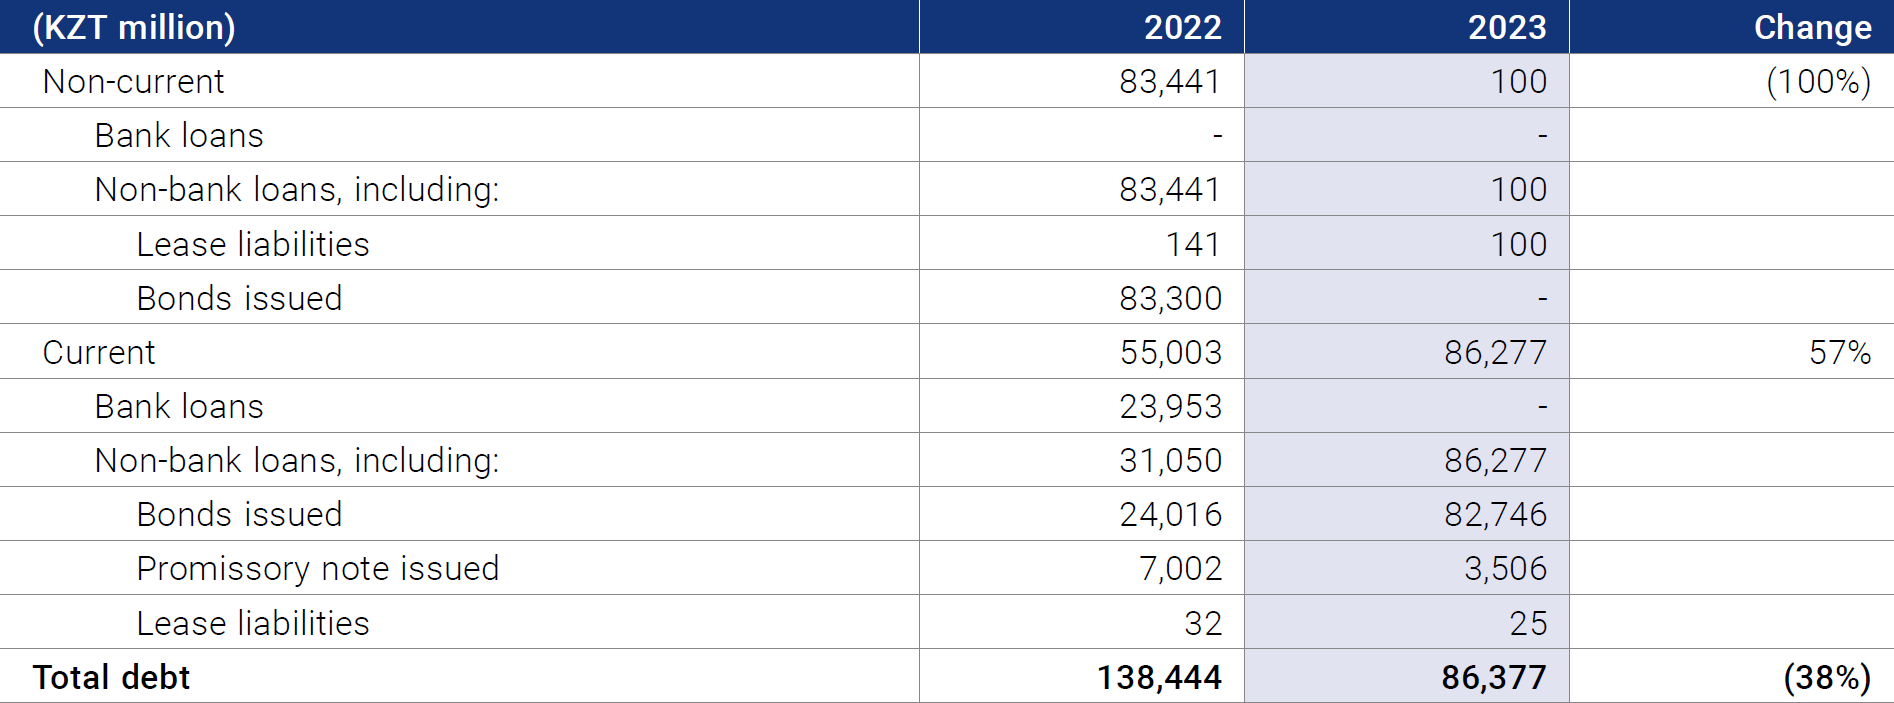
As of 31 December 2023, the Group has no long-term bank loans.
The amount of non-bank loans as of 31 December 2023 comprised KZT 86,377 million and includes:
- long-term USD-indexed Company coupon bonds with a nominal amount of KZT 70 billion and maturity in October 2024, issued in September 2019 on the Kazakhstan Stock Exchange (KASE);
- promissory notes owned by JV Khorasan-U LLP are with maturity "on demand". As of 31 December 2023, the right to claim under the promissory notes belongs to Kyzylkum LLP.
Guarantees represent off-balance sheet irrevocable obligations of the Group to effect payment in the event that another cannot meet its obligations.
Other liabilities of the Group are finance leases, other debt and leases.
Under the loan and guarantee agreements, the Group is required to comply with certain established nonfinancial obligations (covenants). During the year the Group fulfilled all of the above obligations. The Group has no obligations under financial covenants.
The following table summarises the Group’s weighted average interest rate for bank loans in 2023 and 2022:
Weighted average interest rate, including:

Fixed interest
rate

As of 31 December 2023, the weighted average interest rate was 3.81%, which was higher compared to the prior year. The Group's weighted average interest rate on loans and borrowings in 2023 was mainly influenced by the Group's long-term fixed-interest rate liabilities (bonds with a coupon of 4% per annum).
As of 31 December 2023, the Group's liabilities are fully formed from debt with a fixed interest rate.
The Company has been assigned credit ratings from international rating agencies:
- Moody's Investors Service Baa2, the outlook is "Positive" (confirmed on 30 October 2023);
- Fitch Ratings BBB, the outlook is "Stable" (confirmed on 19 January 2024).
NET DEBT/ADJUSTED EBITDA
The following table summarises the key ratios used by the Company’s management to measure financial stability in 2023 and 2022. Management targets a net debt to adjusted EBITDA of less than 1.0.
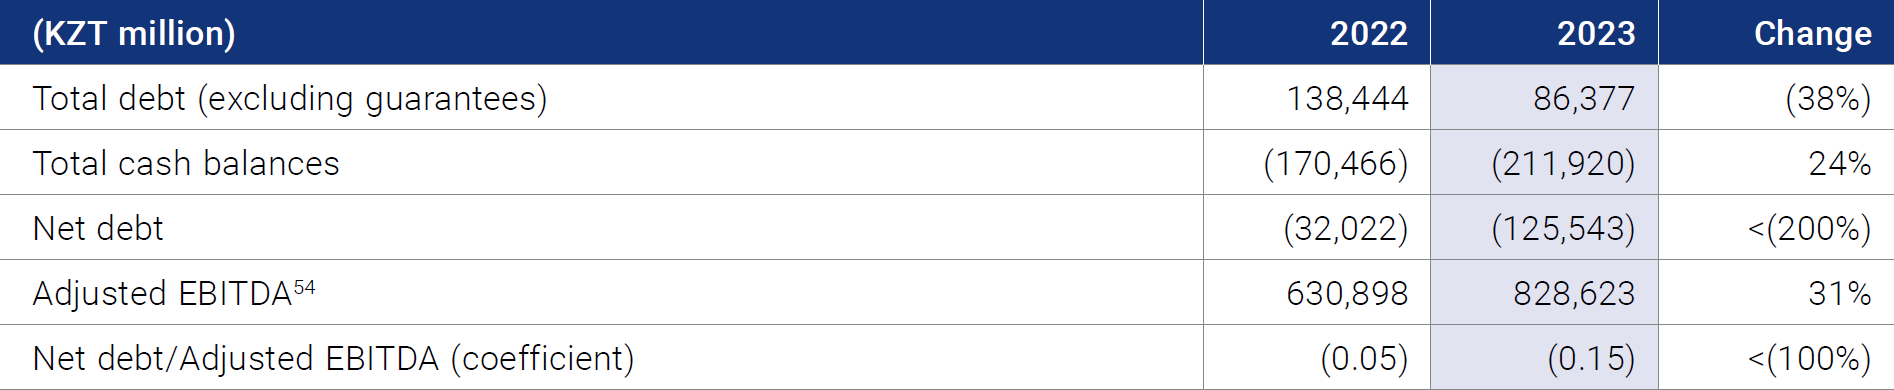
54 Adjusted EBITDA is calculated by excluding from EBITDA items not related to the main business and having a one-time effect. Calculation: Profit before tax - finance income + finance expense +/- Net FX loss/(gain) + Depreciation and amortisation + Impairment losses - reversal of impairment +/- one-off or unusual transactions.
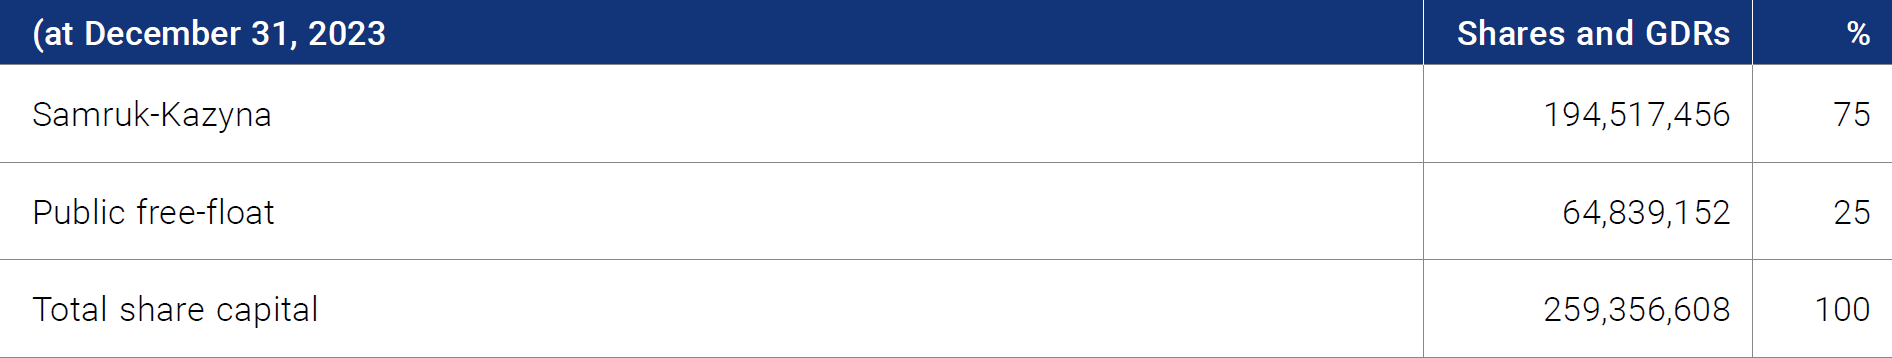
Outstanding Shares
There were no changes to Kazatomprom’s share capital structure during 2023. As of 31 December 2023, the number of outstanding ordinary shares of the Company was 259,356,608 (same in 2022), of which 75% was held by Samruk-Kazyna JSC and 25% of shares/global depositary receipts listed on the Astana International Exchange (AIX) and the London Stock Exchange (LSE) were free floated. One global depositary receipt represents one ordinary share. Each ordinary share grants the right to one vote.
Guidance for 2024
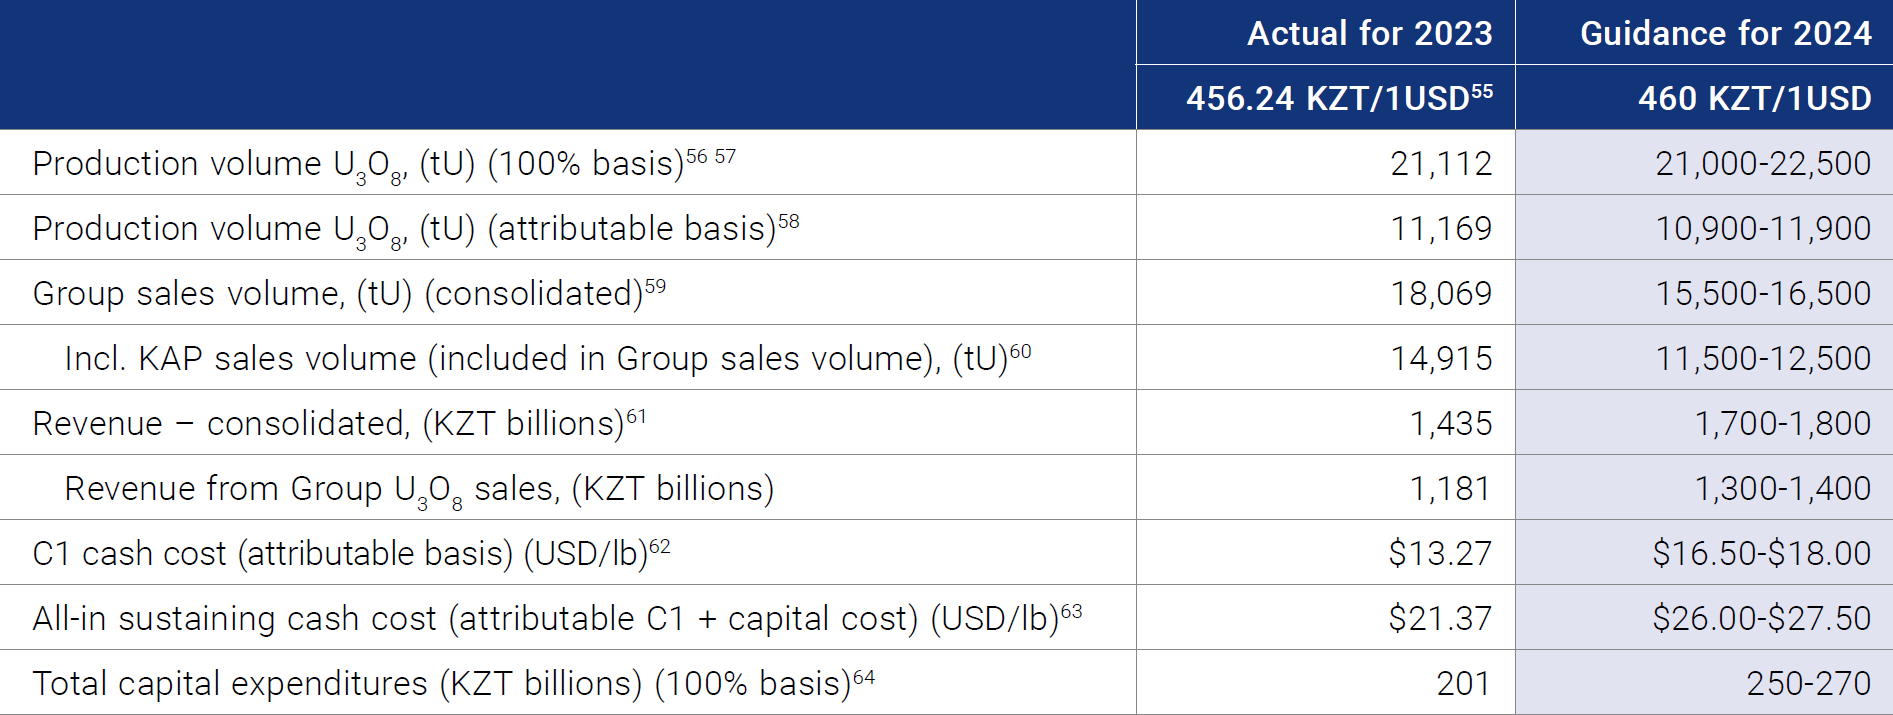
* For certain joint ventures, in cases where a partner declines to purchase their share of production, the Company has the right to purchase such additional volume (beyond the volume of production proportional to the Company's shareholding).
55 The average exchange rate for 2023.
56 Production volume (100% basis): Amounts represent the entirety of production of an entity in which the Company has an interest; it disregards that some portion of production may be attributable to the Group’s JV partners or other third-party shareholders.
57 The duration and the full impact of the Russian-Ukrainian conflict are not yet known. Annual production volumes could therefore vary from internal expectations.
58 Production volume U3O8 (tU) (attributable basis): Amounts represent the portion of the production of an entity in which the Company has an interest, corresponding only to the size of such interest; it excludes the portion attributable to the JV partners or other third-party shareholders, except for JV Inkai LLP, where the annual share of production is determined as per Implementation Agreement as disclosed in IPO Prospectus. Actual drummed production volumes remain subject to converter adjustments and adjustments for in-process material. For JV Budenovskoye LLP, 100% of the 2024-2026 annual production is fully committed for supplying the needs of the Russian civil nuclear energy industry, under an offtake contract at market-related terms.
59 Group sales volume, tons: includes sales of U3O8 by Kazatomprom and its consolidated subsidiaries and affiliates (companies that KAP controls by having: (i) the power to direct relevant activities that materially affect their profitability, (ii) the influence or right to change earnings its involvement with such entities and (iii) its ability to use its power over such entities to influence the Group's earnings. The existence and influence of substantive rights, including significant potential voting rights, are taken into account when assessing KAP's control over another entity). The Group's U3O8 sales volumes do not include sales of other forms of uranium (including, but not limited to, sales of fuel pellets).
60 KAP sales volume: includes only the total external sales of KAP HQ and THK. Intercompany transactions between KAP HQ and THK are not included.
61 Expected revenues are based on uranium prices and tenge/U.S. Dollar exchange rates obtained at a given point in time from third party sources. The prices and tenge/US Dollar exchange rates used do not reflect Kazatomprom's internal forecasts, and 2023 revenues may be significantly affected by differences in actual prices and tenge/US Dollar exchange rates from those forecast by third party sources.
62 The conversion of kgU to pounds U3O8 is 2.5998.
63 The conversion of kgU to pounds U3O8 is 2.5998.
64 Total capital expenditures (100% basis): includes only capital expenditures of the mining entities, includes significant CAPEX for investment and expansion projects. Excludes liquidation funds and closure costs. For 2024 includes development costs for mining infrastructure of JV Budenovskoye LLP, JV Katco LLP (South Tortkuduk) and MC Ortalyk LLP (Zhalpak) for a total amount of approximately KZT 85 billion.
Production in 2024 is expected to be in the range of 21,000-22,500 tonnes of uranium and in the range of 10,900-11,900 tonnes of uranium on a 100% basis and on an attributable basis, respectively (earlier in 2022, initial production plans for 2024 were announced as 25,000-25,500 tonnes of uranium on a 100% basis). The decrease in production volumes is caused by difficulties related to the availability of sulphuric acid and delays in construction work at new deposits/ sites, as previously announced by the Company on 12 January 2024.
The Company expects that the level of uranium production of most mining assets will be at the level of -20% of the Subsoil Use Contracts and the Company will make every effort to exclude cases of violation of obligations in terms of production volumes according to the Subsoil Use Contracts. But enterprises that have subsoil use rights to newly commissioned deposits/ areas have the risk of a reduction in production levels by more than 20% of Contractual obligations due to delays in construction work on the surface complex and infrastructure.
To date, the Company has entered into contracts for the supply of the required volume of sulfuric acid, which may allow it to meet expectations for the production plan for 2024 at a level of minus 20% of the volumes established in subsoil use contracts. The difficult situation with the availability of sulphuric acid and delays in construction work at new deposits/sites makes significant uncertainties and may affect the Company's forecast operating performance for 2024. But the Company will make every effort to solve these problems and will inform stakeholders as the situation changes.
Sales volume guidance for 2024 is aligned with the Company’s market-centric strategy as well. The Group expects to sell between 15,500 tU and 16,500 tU, including expectations for the Company sales volumes in the range of 10,900-1,900 tons of uranium, which corresponds to actual figures for 2023. Decrease in 2024 sales volume guidance in comparison to 2023 at both the Group and KAP levels is due to higher sales of EUP to “Ulba-FA” LLP for subsequent production of fuel assemblies and aimed at ensuring sufficient level of inventories for the future periods.
Revenue, C1 cash cost (attributable basis) and All-in Sustaining cash cost (attributable C1 + capital cost) may vary from the guidance provided if the KZT to USD exchange rate fluctuates significantly during 2024. Increase in spot market price for U3O8 affecting the MET (see Section Taxation and Mineral Extraction Tax (“MET”)) as well as procurement and supply chain issues, including inflationary pressure on production materials and reagents, are expected to continue throughout 2024, this may affect the Company’s financial metrics and giving rise to an expectation that C1 cash cost and All-in Sustaining cash cost will be higher in 2024 than in 2023. Guidance will be updated if the aforementioned uncertainties persist throughout 2024.
Total capital expenditures on 100% basis guidance for 2024 increased significantly in comparison to 2023 results to cover the shift in wellfield development activities (see Section Expenditures review), increase in purchase prices for materials, supplies, equipment and cost of drilling, as well as growth in the well construction and mine development costs of JV Budenovskoye LLP and JV Katco LLP (South Tortkuduk) and MC Ortalyk LLP (Zhalpak) for a total amount of approximately KZT 85 billion.
The Company continues to target an ongoing inventory level of approximately six to seven months of annual attributable production The Company may purchase uranium from the spot market while continuing to monitor market conditions for opportunities to optimise its inventory.
URANIUM SALES PRICE SENSITIVITY ANALYSIS
The table below indicates how the Group’s U3O8 annual average sales price may respond to changes in spot prices (shown in the left column), for a given year (shown across the top row). At present, the table clearly indicates that the Group’s U3O8 average sales prices are closely correlated with the uranium spot market price.
This sensitivity analysis should be used only as a reference, and actual uranium market spot prices may result in different U3O8 annual average sales prices than those shown in the table. The table is based upon several key assumptions, including estimates of future business opportunities, which may change and are subject to risks and uncertainties outside the Group’s control. Please review the footnotes under that table and refer to the section Forward-looking statements for more information.
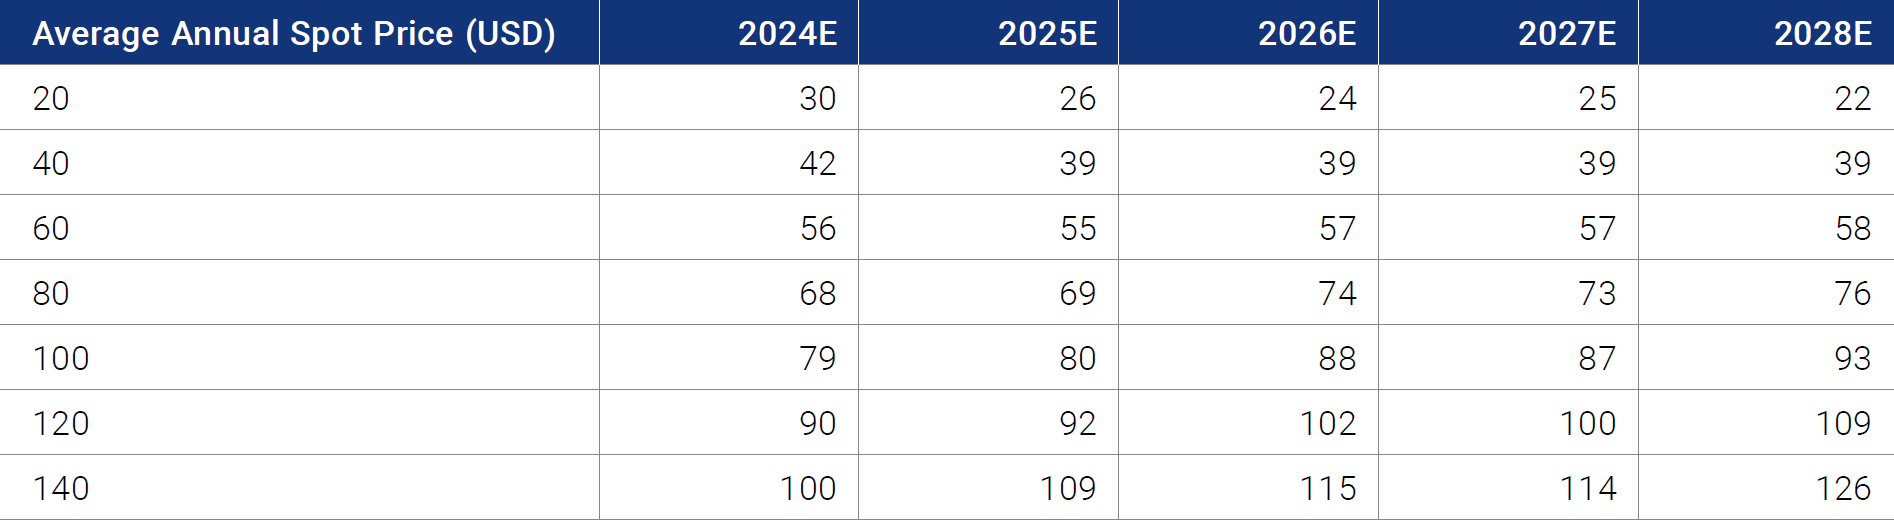
Values are rounded to the nearest dollar. The sensitivity analysis above is based on the following key assumptions:
- Annual inflation is assumed to be 2% in the US based on historic values, for the purposes of this analysis.
- Analysis is as of 31 December 2023 and prepared for 2024-2028 on the basis of minimum average Group annual sales during the specified period of approximately 18,000 tonnes of uranium in the form of U3O8, of which the volumes contracted as of 31 December 2023 will be sold per existing contract terms (i.e. contracts with hybrid pricing mechanisms with a fixed price component (calculated in accordance with an agreed price formula) and/or combination of separate spot, mid-term and longterm prices); Kazatomprom’s marketing strategy does not target a specific proportion of fixed and market related contracts in its portfolio in order to remain flexible and react appropriately to market signals.
- For the purpose of the table, uncommitted volumes of U3O8 are assumed to be sold under short-term contracts negotiated directly with the customers and based on spot prices.